
The steep declines caused by the 2008 Global Financial Crisis have remained ingrained in investor psyche, especially when a year like 2011 occurred so closely thereafter. Driven by contagion fears from the European sovereign debt crisis, global equities delivered disappointing returns that year, which kept investors on edge. Since then, market participants have been on the lookout for the time when economic momentum would derail and stock markets would correct meaningfully. However, thanks to resilient economic growth, the blips that were seen in 2015 and 2016 gave way to 2017’s extremely strong and consistent performance.
But 2018 was different, to say the least.
Through the end of December 2018, a 60/40 portfolio comprised of global stocks and bonds was down -3.69%. This is only the second time in 28 years that both stocks and bonds are negative and the eighth time the 60/40 portfolio would have delivered a negative return1. In addition, with cash now offering a yield greater than US large cap equities, investors are likely no longer going to be forced to take on risk for return like they may have needed to do when rates were pinned to zero. Looking ahead to 2019, expectations are that we may need to accept growing uncertainty whether it be in regards to monetary policy, the political environment or international relations.
The Macro Backdrop
This economic cycle has been the slowest on record, but also one of the longest. Looking ahead, most well-followed indicators are still pointing toward expansion. However, on a rate of change basis, we are seeing many of these same measures begin to slow, including the most recent Purchasing Manufacturing Indexes (PMIs) across developed and emerging markets which have remained in expansion territory, but well below levels seen earlier in the year2. This does not necessarily point to an outright contraction anytime soon, but illustrates the natural state of a lengthy expansion getting lengthier, especially as additional means to stimulate growth may be limited as the multiplier effect of stimulus sees less impact at later stages of a cycle as opposed to coming out of a contraction.
Related – Relative Weight Spotlight: China is No Paper Dragon
With this being the case, economic growth is expected to slow marginally in 2019 after strong growth in 2017 and 2018. While long-term impacts of the US tax cuts may be limited, both critics and supporters say it may take years to draw conclusions on their effect, but benefits should continue to be seen in 2019. As written in recent Fed minutes, the US economy is at or close to full employment, highlighting that additional job growth may come at the expense of an overheating economy. The results of the midterm elections will likely mean that there will be no additional tax cuts or meaningful spending packages coming down the pipe in the US, especially when funding for border security is being used as a bargaining chip during the recent government shutdown.
FIGURE 1: GLOBAL GROWTH IS EXPECTED TO SLOW IN 2019, BUT REMAIN STRONG
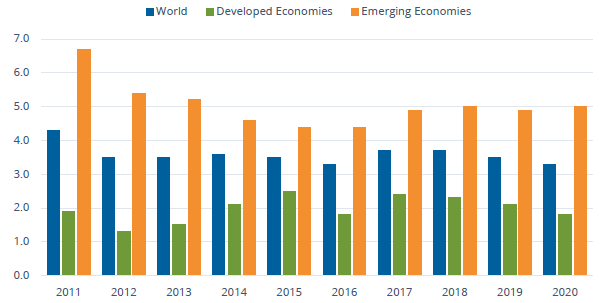
Source: Bloomberg Finance, L.P., Figures for 2018, 2019 and 2020 are Bloomberg Contributor Composites. GDP readings for country groups as defined by Bloomberg.
Brexit Looms
Even with that geopolitical uncertainty, economies outside of the US will face a more difficult environment than the US. Issues around the potential for a lack of a Brexit deal before March looms large over the U.K. and companies will likely need to plan for the worst, impacting investment in the U.K. and weighing on an already weak Pound. Mainland Europe remains beset by structural challenges that they have been unable to adequately resolve. Italy’s recent budgetary issues highlight the latest in these trials. The ECB recently announced that they will wind down its bond purchase program, but will continue reinvesting its maturing bonds. Investors may actually see the ECB raise rates in the second half of 2019 or in early 2020.
Japan Rising?
Japan is expected to see modest growth in 2019, despite recent indicators suggesting that they may continue to face challenges. Since his election in 2012, Prime Minister Abe has focused on a three-pronged approach to stimulate growth, with recent trade agreements among the latest accomplishments. Formally known as TPP, the CPTPP goes into effect this year along with the EU-Japan EPA, both of which will likely benefit the Japanese economy. Of course, even with these agreements, slowing global trade is a headwind for the export-orientated economy, along with a recently strengthening yen, making the picture on Japan mixed. Lastly, here is hoping that Mother Nature brings none of the natural disasters that the country experienced in 2018.
Emerging Markets. Is this the year?
Emerging markets face headwinds thanks to trade tensions and Federal Reserve tightening resulting in a stronger USD. While the long-term consumer growth story exists, China’s been actively restructuring its economy, including looking to deleverage its growth of corporate debt that was built up post the end of the Global Financial Crisis and now faces even greater questions driven by the ongoing trade spat, in addition to the challenges from its ongoing transition away from a capital investment led economy, to a consumption led one.
Will Rate Rise Pause in the U.S.?
While a narrow portion of the yield curve inverted, spreads, such as 2-year to 10-year and the 3-month to 10-year, remain positive. This flattening has been driven by the short end rising faster than the long end. Based on historical precedent, the yield curve mayinvert in 2019, meaning that the potential for a US recession could be on the radar for 2020. Due to energy prices being contained, inflation should likely be subdued. Since peaking in early October, inflation breakevens, which measure the difference in yield between a nominal bond and an inflation-linked bond of similar maturity, have been on a steady decline, highlighting that inflation expectations remain restrained as highlighted in Figure 2. This may complicate the FOMC’s decision on its hiking path more so than the recent stock market volatility, especially as they emphasized the need for data dependency.
FIGURE 2: INFLATION EXPECTATIONS HAVE DECLINED
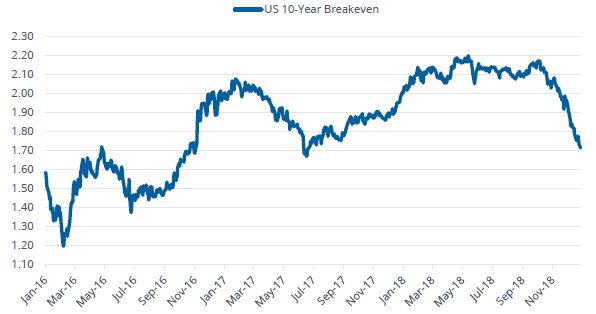
Source: Bloomberg Finance, L.P., as of December 31, 2018.
Trade Tariffs or Truce?
From a risk perspective, uncertainty around trade, especially related to US and China, will likely be a source of both upside and downside risks. A bigger question resides around the fact that the norms of years past are subsiding as countries take a more unilateral approach to decision making and international relations, complicating investors’ ability to accurately measure what truly may be coming next.
THE MARKETS IN CONTEXT
With rates rising and stocks selling off, valuations came down materially in 2018, but remain higher than historical averages on most measures. Looking back, multiples first declined during the February sell-off and never recovered. Much of this sentiment may be that investors are acknowledging that margins have likely peaked in this cycle. Caterpillar Inc. (CAT), the global industrial giant, gave the market hints of this back in July, citing that their first quarter adjusted EPS was the “high watermark” for the year. More recently, FedEx Corp. (FDX) slashed its earnings guidance for 2019, warning that global trade is slowing. Overall, many of the post financial crisis tailwinds, such as surging profit growth and favorable risk appetite boosting multiples are now becoming headwinds in 2019. With technology creating more insights and connectivity than ever before, we are experiencing a quicker reaction function to news, whether positive or negative.
FIGURE 3: THE MARKET SELLOFF HAS BEEN A VALUATION STORY, NOT AN EARNINGS ONE

Source: Bloomberg Finance, L.P., as of December 31, 2018. Price, EPS, and P/E are for the MSCI ACWI, and normalized to 100 as of December 31, 2017. Past performance is not indicative of future results.
One of the main drivers of stock markets will be the direction of interest rates and how the ongoing perception of the path evolves. Historically, periods of rising rates coincided with economic expansion, but the extraordinary monetary policy, which pinned rates to zero after the financial crisis complicates this relationship as rates were so low for so long. Even if rates do not rise materially above current levels, investors will likely continue to focus on the yield curve. With rising rates on the short end of the curve, long duration assets have been negatively impacted. These not only include bonds, but equities with longer durations, such as growth stocks.
Related: Look to Emerging Market ETFs for Opportunities
With economic growth remaining strong but slowing, markets may be pushed and pulled along by geopolitical events and any surrounding rhetoric. With daily catalysts less focused on fundamentals, earnings will likely need to remain robust to help propel markets higher. However, expectations look to be lower than 2018 as it will be difficult for investors to assign higher multiples to lower growth as the sizable tax cut-related boost will not be present. In addition, stocks are no longer the only alternative for investors to see capital appreciation thanks to cash now offering an actual yield with minimal concerns about its volatility. With this being the case, market participants remain skeptical in January, 2019, but any string of positive news can provide support for equity markets.
FIGURE 4: THE YIELD CURVE CONTINUES ITS RELENTLESS FLATTENING

Source: Bloomberg Finance, L.P., as of December 31, 2018.
Basis Points = one hundredth of one percent, used chiefly in expressing differences of rates.
Volatility: The New Old Normal
Overall, investors should brace for a continued environment of normal volatility, both up and down. In other words, the calm of 2017 should be considered an anomaly. Figure 5 details the average intraday range of the S&P 500 Index. One can see that 2017’s intraday ranges were a third of the historical average. In fact, 2018’s range is lower than the average. As the year progresses, markets may continue to price in the potential for recession or simply a material slowdown making in challenging to see trends last for long.
FIGURE 5: S&P 500 INTRADAY RANGES ACTUALLY REMAIN BELOW HISTORICAL AVERAGES
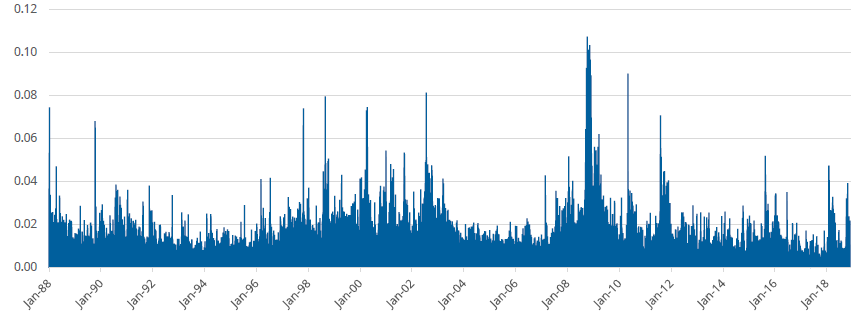
Source: Bloomberg Finance, L.P., data as of January 1, 1988 – December 31, 2018. Past performance is not indicative of future results.
WHAT WILL MATTER MOST?
Given the existing sentiment and subdued expectations for broad based performance going forward, it will be important for investors to be more selective with where they make allocations in 2019 and beyond. While day-to-day market moves will continue to be driven by headlines and investor sentiment, over 12 to 36 month periods, macro relationships tend to play a greater role.
US Large Cap & Small Cap
After years of outperformance, large caps see relatively unattractive valuations compared to small caps driven with large cap multiples rising sharply over the past two years. However, small cap valuations are actually above historical averages. At the same time, earnings growth expectations remain lower for small caps than large caps highlighting that a catalyst for small cap outperformance may need to come from upside surprises as valuations alone may not provide support for a rotation.
Looking to 2019, return differences between large and small caps will likely continue to be driven more by how investors value higher quality balance sheets and the potential for continued volatility as opposed to any headlines related to trade or taxes. In other words, if investors price in the need for more quality exposure and a need to hunker down, large caps will likely benefit relative to small, as small caps operate with higher balance sheet leverage and weaker capital efficiencies.
FIGURE 6:
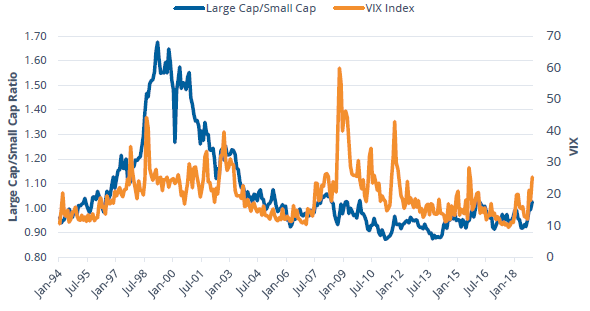
Source: Bloomberg Finance, L.P., as of December 31, 2018. Large Cap represented by the Russell 1000 Index, Small Cap represented by the Russell 2000 Index and VIX represented by the Chicago Board Options Exchange Volatility Index. Past performance is not indicative of future results.
US Growth & Value
With US growth stocks beginning to lose momentum in the past couple of months, value zealots have come out proudly trumpeting the opportunity for a long awaited shift to occur. Of course, performance paints an easy picture for arguing for a reversal of the long run dominance of growth, and recent flows suggest investors may be positioning accordingly.
However, as witnessed over the past years, these pockets of reversal have been short lived. One of main reasons these periods have not persisted is that value stocks historically do best in periods of a steepening yield curve, not a flattening one, as steepening yield curves tend to be associated with improving economic growth where previously out of favor stocks may see a boost in their outlook. In addition, because of their cyclical nature, value stocks tend to do best at the start of cycles, making it challenging to see value stock performance to be sustained outside of a valuation-led growth flush out, which could certainly occur. However, the relative multiple between growth and value stocks has compressed to levels below the historical median making the case for further contraction mixed with value stocks offering less expected earnings and much lower levels of capital efficiency than growth stocks.
FIGURE 7:
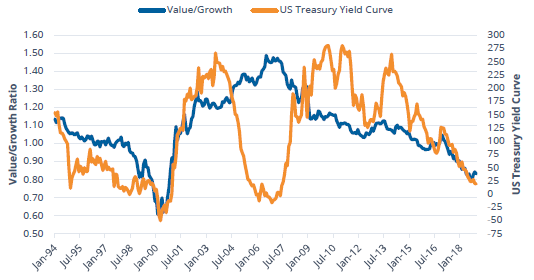
Source: Bloomberg Finance, L.P., as of December 31, 2018. Value represented by the Russell 1000 Value Index, Growth represented by the Russell 1000 Growth Index and US Treasury Yield Curve represented by the spread between US 10-Year and US 2-Year Treasuries. Past performance is not indicative of future results.
US Cyclical Sectors & Defensive Sectors
Cyclical sectors have outperformed defensive sectors by over 5% over the last three years, but lost to defensives in 2018 by 2.46%3. On average, cyclicals trade at a higher multiple than defensives, but have higher expected earnings growth and offer higher returns on equity albeit with greater leverage. Nearly, one third of a cyclical index is comprised of information technology stocks with financials making up another 20%. On the other hand, healthcare comprised 46% of defensives.
