

Should volatility be elevated thanks to back and forth on trade, investors may flock to defensives. However, should volatility be driven by concerns regarding rising rates then, defensives may not offer a safe haven thanks to their bond proxy nature. The picture is also mixed thanks to questions that surround financials. In addition, the potential for increased capital expenditures that could benefit sectors, such as industrials, may be muted as well.
FIGURE 8:
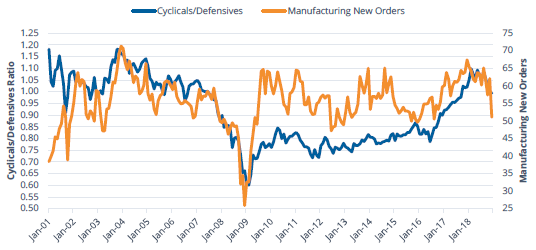
Source: Bloomberg Finance, L.P., as of December 31, 2018. Cyclicals represented by the MSCI USA Cyclical Sectors Index, Defensives represented by MSCI USA Defensive Sectors Index and Manufacturing New Orders represented by the ISM Manufacturing Report on Business New Orders. Past performance is not indicative of future results.
US & International
With the US economy still chugging and the corporate tax cut trickling down firm’s income statements, EPS expectations remain higher for the US than international markets. Providing the potential for further support are buybacks in the US, which have been a powerful support mechanism for US shares and are expected to continue into 2019.
However, from a variety of valuation measures, US stocks are materially overvalued relative to international thanks to a large increase in the US multiple. In fact, multiples for international stocks are below their historical averages with levels not seen since 2013. Sector differences account for much of this as Information Technology is the largest sector in the US, and Financials are the largest outside of the US. Political uncertainties in Europe will continue to weigh on risk sentiment as well. However, positive outcomes to these would boost international markets on a relative basis significantly.
FIGURE 9:
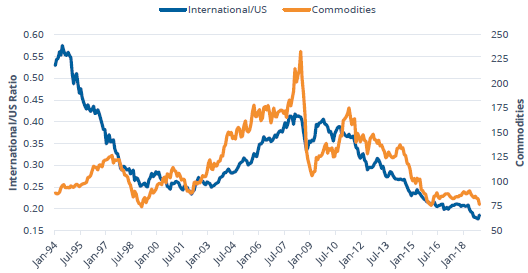
Source: Bloomberg Finance, L.P., as of December 31, 2018. International represented by the FTSE
All-World ex US Index, US represented by the Russell 1000 Index and Commodities represented by the Bloomberg Commodity Index. Past performance is not indicatibe of future results.
Developed Markets & Emerging Markets
Other than investors focused on the long-term story, market sentiment toward emerging markets remains mixed. On one hand, investors have begun to reallocate to emerging markets with robust flows over the past couple of months. On the other hand, relative performance in 2018 was challenging.
EM’s discount to developed markets has been relatively attractive. At the same time, earnings expectations have improved and actually look favorable for EM. Of course, if the Federal Reserve feels that the data to raise rates faster than expected, EM would suffer. Overall, if some of the concerns, such as trade or idiosyncratic issues do not come to fruition, investors may jump into EM equities, especially with the attractive relative valuations. Net-net, the direction of global growth will likely remain the greatest driver of performance with EM outperforming if growth ticks up and DM doing well with slowing growth.
Lastly, investors should be aware of the continued increase in exposure to China A-Shares and the addition of Saudi Arabia, the largest market in the Middle East and Africa, to its emerging market indexes. It will be important for investors to be aware of shifts in exposures to these regions.
FIGURE 10:
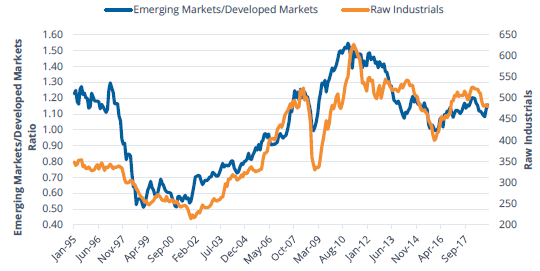
Source: Bloomberg Finance, L.P., as of December 31, 2018. Emerging Markets represented by the MSCI Emerging Markets IMI, Developed Markets represented by MSCI EAFE IMI and Raw Industrials represented by the CRB Raw Industrials Spot Price Index. Past performance is not indicative of future results.
Footnotes:
1 The 60/40 portfolio is comprised of 60% MSCI ACWI and 40% Bloomberg Barclays Global Aggregate Index.
2 PMIs measured by the Markit Developed Markets Manufacturing PMI and Markit Emerging Markets Manufacturing PMI.
3 Cyclicals represented by the MSCI USA Cyclical Sectors Index and Defensives represented by MSCI USA Defensive Sectors Index.
Index Descriptions:
- MSCI ACWI : The MSCI ACWI captures large and mid-cap representation across 23 Developed Markets and 24 Emerging Markets countries. The index covers approximately 85% of the global investible equity opportunity set.
- Russell 1000: The Russell 1000 Index consists of the largest 1,000 companies in the Russell 3000 Index, which is made up of 3,000 of the largest U.S. companies.
- Russell 2000: The Russell 2000 Index is comprised of the smallest 2000 companies in the Russell 3000 Index, representing approximately 8% of the Russell 3000 total market capitalization.
- Barclays Global Aggregate Index: The Bloomberg Barclays Global Aggregate Bond Index is a flagship measure of global investment grade debt from twenty-four local currency markets. This multi-currency benchmark includes treasury, government-related, corporate and securitized fixed-rate bonds from both developed and emerging markets issuers.
- VIX: The Chicago Board Options Exchange Volatility Index reflects a market estimate of future volatility, based on the weighted average of the implied volatilities for a wide range of strikes.
- Russell 1000 Value: The Russell 1000 Value Index measures the performance of those Russell 1000 companies with lower price-to-book ratios and lower forecasted growth values.
- Russell 1000 Growth: The Russell 1000 Growth Index measures the performance of those Russell 1000 companies with higher price-to-book ratios and higher forecasted growth values.
- MSCI USA Cyclical Sectors: The MSCI USA Cyclical Sectors Index is based on MSCI USA Index, its parent index and captures large and mid-cap segments of the US market. The index is designed to reflect the performance of the opportunity set of global cyclical companies across various GICS® sectors. All constituent securities from Consumer Discretionary, Financials, Industrials, Information Technology and Materials are included in the Index.
- MSCI USA Defensive Sectors: The MSCI USA Defensive Sectors Index is based on MSCI USA Index, its parent index and captures large and mid-cap segments of the US market. The index is designed to reflect the performance of the opportunity set of global defensive companies across various GICS® sectors. All constituent securities from Consumer Staples, Energy, Healthcare, Telecommunication Services and Utilities are included in the Index.
- FTSE All-World ex US: The FTSE All-World Excluding United States Index is a free float market capitalization weighted index. FTSE All-World Indices include constituents of the Large and Mid-capitalization universe for Developed and Emerging Market segments.
- MSCI Emerging Markets IMI: The MSCI Emerging Markets Investable Market Index (IMI) captures large, mid and small cap representation across 24 Emerging Markets (EM) countries.
- MSCI EAFE IMI: The MSCI EAFE Investable Market Index (IMI), is an equity index which captures large, mid and small cap representation across Developed Markets countries around the world, excluding the US and Canada.
- Bloomberg Commodity Index: Bloomberg Commodity Index (BCOM) is calculated on an excess return basis and reflects commodity futures price movements.
- CRB Raw Industrials Spot Price Index: Commodity Research Bureau Raw Industrials Index measures price movements of basic raw industrial commodities.
Risks: Investing involves risk including possible loss of principal. The ETFs’ investments in derivatives may pose risks in addition to, and greater than, those associated with directly investing in or shorting securities or other investments. There is no guarantee that the returns on an ETF’s long or short positions will produce high, or even positive returns and the ETF could lose money if either or both of the ETF’s long and short positions produce negative returns. Please see the summary and full prospectuses for a more complete description of these and other risks of the ETFs.
An investor should carefully consider a Fund’s investment objective, risks, charges, and expenses before investing. A Fund’s prospectus and summary prospectus contain this and other information about the Direxion Shares. To obtain a Fund’s prospectus and summary prospectus call 646-569-9363 or click here. A Fund’s prospectus and summary prospectus should be read carefully before investing.
Distributor: Foreside Fund Services, LLC