Emerging v. Developed Markets
Drama around the U.S.–China trade deal, the harsh realities of the Brexit transition, and political dysfunction across continental Europe is leading to speculation on where world economies and markets are headed. Purchasing Manufacturing Indexes (PMIs) in major developed and emerging markets have trended negatively over the last 6 months, based on JPM Global PMI readings, indicating that economic output is waning.
Of course, bulls will point to December’s selloff as proof that the discounting mechanism of markets has reflected this into prices and that valuations are now in line to support what most are expecting to be lackluster earnings in the early part of this year.
More concerning may be investor skepticism toward developed markets as the MSCI EAFE IMI index has failed to rebound in January like a majority of its counterparts, especially when measured in U.S. dollars. In times of geopolitical uncertainty and slowing economic growth, one would expect emerging markets to be the group suffering the most, but the recent Federal Reserve dovishness and rebound in commodities prices has supported shares.
U.S.–China trade rhetoric/optimism may also be a major factor behind the below divergence between the emerging and developed baskets.
To note, an over 8% divergence between the two has emerged in just 146 days.
Developed Markets have Failed to Bounce Back from December’s Selloff

Source: Bloomberg Finance, L.P., data from September 20, 2018 to February 12, 2019. Global Markets is represented by the MSCI ACWI IMI, Developed Markets is represented by the MSCI EAFE IMI, Emerging Markets is represented by the MSCI Emerging Markets IMI and U.S. is represented by the MSCI USA IMI.
Money in Motion
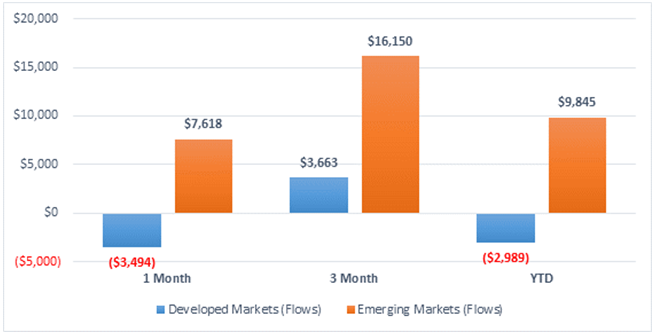
- Whether driven by tax loss harvesting or year-end rebalancing, flows into international ETFs, especially emerging markets have vastly outpaced those into U.S. or developed markets.
- More recent data around flows and positioning suggests that a real trend towards EM assets may be occurring, as longer term flows (12, 24, and 36 months) have largely leaned towards Developed Markets.
Net Flows, in $ Millions