
By Roman Chuyan, CFA, Model Capital Management LLC
- Today’s consumer price inflation numbers were staggeringly high.
- High inflation will likely be followed by rising market interest rates (yields).
- I speculate once again why I think this will prove to be the proverbial pin to prick this bubble.
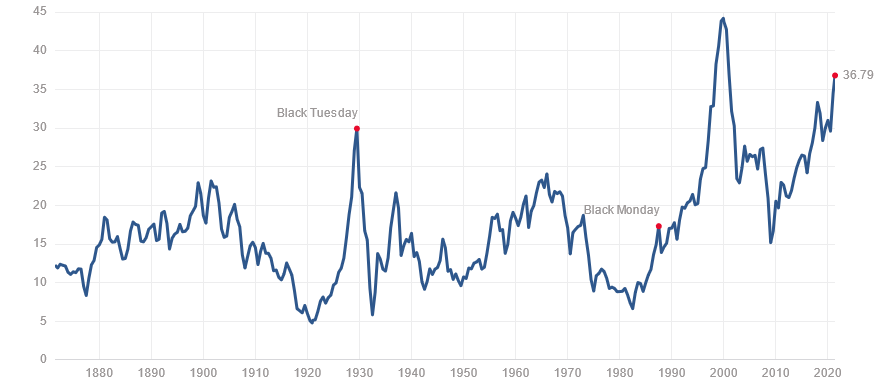
The stocks market rally since April-2020 took it to an extreme valuation. It’s a bubble, pure and simple, as I’ve been writing since February. Reason doesn’t apply to bubbles – instead, they are sustained by crowd mentality. Still, all bubbles burst – the bigger the bubble, the more severe the crash. This bubble in stocks (and in bonds, real estate, etc.) is very big, in no small part due to the Fed’s policies. By most measures, the market valuation is at its highest in at least 150 years, as I detailed in my recent articles (see here and here). Once again, the Shiller’s P/E ratio, which controls for earnings cyclicality, is at its highest in at least 150 years (other than the dot-com bubble in 1999-2000):
But, when will the bubble burst? Timing is hard to determine in advance, and a burst needs a catalyst. We began pointing to rising inflation and market interest rates (yields) since March as potential catalyst, and it became clear by early May that inflation was poised to jump. Finally, in my Monday’s article I expected inflation to jump substantially as soon as this week (May 12th).
In today’s update, I review the latest inflation numbers, and speculate once again why I think it will prove to be the proverbial pin to prick this bubble. It’s still early to talk about how much downside is expected – once it’s clear that the bubble has burst, it will be the topic for future articles – stay tuned. I will also mostly leave out the reasons why we think inflation is rising.
First, let us note an important relationship that predicates my argument – one between inflation (and inflation expectations) and market yields (say, the 10-year Treasury yield). Such relationship held, albeit somewhat loosely, since Treasury yields were floated in the early 1960’s. Most of the time (but not now), the yield exceeds inflation, to compensate investors:
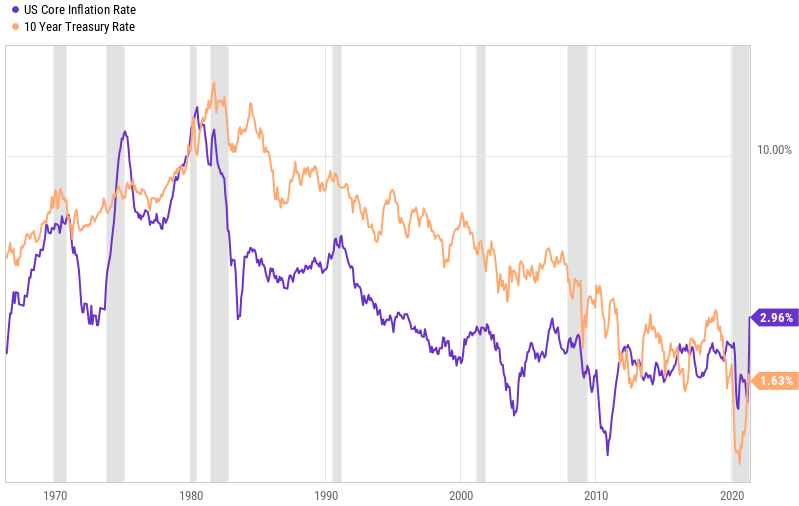
Source: Ycharts, shaded are recessions.
It is plausible that the Fed’s new (since 2008) bond-buying habit forces yields to stay well below inflation. However, this is a double-edged sword because the Fed buying bonds amounts to money-creation, which will likely drive inflation even higher. This possibility aside, we assume that yields will rise from here and follow inflation higher.
Rising yields will be the proverbial pin. Higher yields have historically had a negative effect on the stock market. Market volatility has already increased this week, and I think stock investors are rightfully concerned. Recall that stocks began to drop the moment the 10-year Treasury yield rose above 3.2% in October of 2018 (see chart below). The concern was, and remains, that higher rates would burden the financial system due to enormous debt. This time, the “too-high” yield level will likely be lower, because there’s even more debt and we’ve been conditioned by near-zero rates in 2020-21. What’s that critical level? My guess is as good as yours, but I’d put at the round number of 2% on the 10-year Treasury. The 10-year is currently trading just below 1.7%.
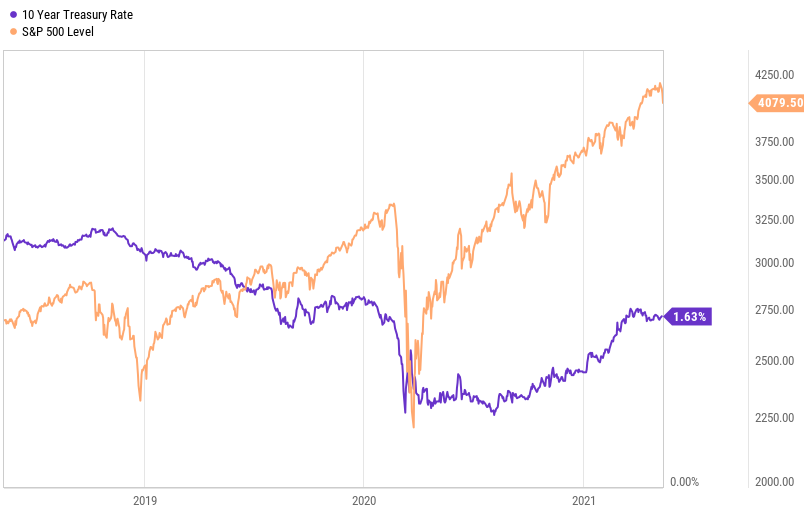
Source: Ycharts
The consumer price index (CPI) numbers for April reported this morning were staggeringly high in the context of low inflation in recent years. The CPI rate jumped to 4.2% well above 3.6% expected, and the highest rate in 12.5 years, since 2008. Core CPI which excludes food and energy jumped to 3%, also well above expectations and its highest since 1996 (24 years):

Source: Ycharts.com
Keep in mind that the earlier consensus expectations (3.6% for CPI) already reflected the “base effect,” or the “transitory” nature of inflation that the Fed officials have recently quoted. So, this jump in inflation was unexpected, and non-transitory (permanent).
I will only briefly mention the reasons for this jump in inflation. At a high level, it’s caused by reduced supply of goods (raw materials, computer chips, etc.) coupled with rising demand for them. The government’s policies have created both. The current administration’s restrict-and-regulate policies cause reduced production. The generous federal stimulus payments caused several million people to leave the labor force, which created labor shortages and reduced production. On the demand side, the trillions in these payments kept demand for goods high (think of the housing boom, for example). A result – self-reinforcing shortages and price increases.
Raw material prices experienced a huge jump in the past 12 months: the CRB Commodity Index is up 70%, and the CRB Non-Energy index is up 50%. Below are some 10-year charts that illustrate the magnitude of the commodity rally. Lumber is the most extreme, with its price now 3-5 times the highest levels seen in 40 years of available history. Most other commodities – for example industrial metals (copper, iron) and foodstuffs (soybeans, wheat, pork) – rose sharply in the past year to 10-year or all-time highs.

Source: Tradingeconomics.com
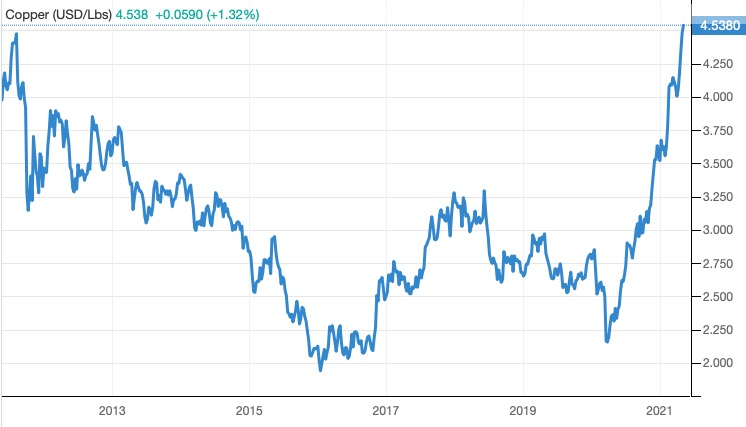
Source: Tradingeconomics.com
About Model Capital Management LLC
Model Capital Management LLC (“MCM”) is an independent SEC-registered investment advisor, and is based in Wellesley, Massachusetts. Utilizing its fundamental, forward-looking approach to asset allocation, MCM provides asset management services that help other advisors implement its dynamic investment strategies designed to reduce significant downside risk. MCM is available to advisors on AssetMark, Envestnet, SMArtX, and other SMA/UMA platforms, but is not affiliated with those firms.
Notices and Disclosures
- This research document and all of the information contained in it (“MCM Research”) is the property of MCM. The Information set out in this communication is subject to copyright and may not be reproduced or disseminated, in whole or in part, without the express written permission of MCM. The trademarks and service marks contained in this document are the property of their respective owners. Third-party data providers make no warranties or representations relating to the accuracy, completeness, or timeliness of the data they provide and shall not have liability for any damages relating to such data.
- MCM does not provide individually tailored investment advice. MCM Research has been prepared without regard to the circumstances and objectives of those who receive it. MCM recommends that investors independently evaluate particular investments and strategies, and encourages investors to seek the advice of an investment adviser. The appropriateness of an investment or strategy will depend on an investor’s circumstances and objectives. The securities, instruments, or strategies discussed in MCM Research may not be suitable for all investors, and certain investors may not be eligible to purchase or participate in some or all of them. The value of and income from your investments may vary because of changes in securities/instruments prices, market indexes, or other factors. Past performance is not a guarantee of future performance, and not necessarily a guide to future performance. Estimates of future performance are based on assumptions that may not be realized.
- MCM Research is not an offer to buy or sell or the solicitation of an offer to buy or sell any security/instrument or to participate in any particular trading strategy. MCM does not analyze, follow, research or recommend individual companies or their securities. Employees of MCM may have investments in securities/instruments or derivatives of securities/instruments based on broad market indices included in MCM Research.
- MCM is not acting as a municipal advisor and the opinions or views contained in MCM Research are not intended to be, and do not constitute, advice within the meaning of Section 975 of the Dodd-Frank Wall Street Reform and Consumer Protection Act.
- MCM Research is based on public information. MCM makes every effort to use reliable, comprehensive information, but we make no representation that it is accurate or complete. We have no obligation to tell you when opinions or information in MCM Research change.
- MCM DOES NOT MAKE ANY EXPRESS OR IMPLIED WARRANTIES OR REPRESENTATIONS WITH RESPECT TO THIS MCM RESEARCH (OR THE RESULTS TO BE OBTAINED BY THE USE THEREOF), AND TO THE MAXIMUM EXTENT PERMITTED BY LAW, MCM HEREBY EXPRESSLY DISCLAIMS ALL WARRANTIES (INCLUDING, WITHOUT LIMITATION, ANY IMPLIED WARRANTIES OF ORIGINALITY, ACCURACY, TIMELINESS, NON-INFRINGEMENT, COMPLETENESS, MERCHANTABILITY AND/OR FITNESS FOR A PARTICULAR PURPOSE).
- “Model Return Forecast” for 6-month S&P 500 return is MCM’s measure of attractiveness of the U.S. equity market obtained by applying MCM’s proprietary statistical algorithm and historical data, but is not promissory, and, by itself, does not constitute an investment recommendation. Model Return Forecasts were calculated and applied by MCM to its research and investment process in real time beginning from 2012. For periods prior to Jan 2012, the results are “back-tested,” i.e., obtained by retroactively applying MCM’s algorithm and historical data available in Jan 2012 or thereafter. Source for the S&P 500 actual returns: S&P Dow Jones.
- Index returns referenced in MCM Research, if any, are gross of any advisory fees, fund management fees, and trading expenses. Fund or ETF returns referenced, if any, are gross of advisory fees and trading expenses. Returns will be reduced by fees and expenses incurred.
