
By Roman Chuyan, CFA, Chief Investment Officer, Model Capital Management LLC
- Some observers agree that the bubble will burst, but timing is harder to determine. Rising inflation and interest rates are the reasons the end is near, in Model Capital’s view.
- Our Equity and Short-Term Risk models continue with Sell signals, dictating defensive positioning.
Stocks continued to rise this year, taking the market to an even-more-extreme valuation. It’s a bubble; there’s no other way to describe it. What will happen, and when?
The first question is much easier to answer than the second. All bubbles inevitably burst – It’s a certainty. The bigger the bubble, the more severe the crash. This bubble in stocks (and in bonds, housing, etc.) will likely burst spectacularly because it’s very big. By several measures, stock market valuation is at its highest in 150 years, as I detailed in my recent commentaries (see here and here). The Fed made it bigger. Many managers don’t dispute the bubble’s fate, but are forced to be in the market by their benchmark or peers (everyone’s doing it), hoping to get out in time.
But, when will it happen? Timing is very important but harder to determine. We at Model Capital have missed on the upside this year because we’ve stayed defensive. Our models don’t let us jump into the market because everyone’s in it – a proper process that eliminates emotional decisions. We know that missing the upside could be unpleasant, but protecting against downside will be more impactful, in our view.
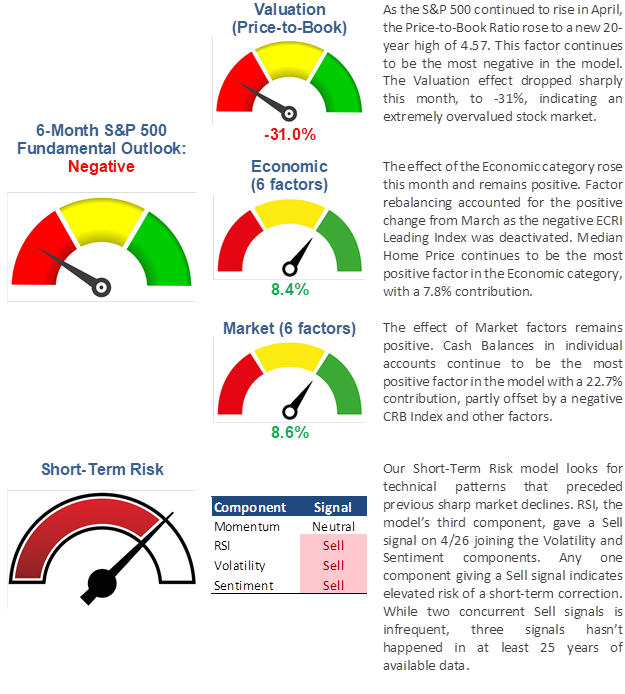
We think that the turn is getting very close, for two reasons. First, the third component of our Short-Term Risk model, based on the RSI index, just gave a Sell signal. Our RSI tool is based on three individual technical indicators combining in a certain pattern. Just one Sell signal by this model indicates elevated shot-term risk. Two concurrent Sell signals are rare, and we’ve never seen three signals at the same time – see the Short-Term Risk section below. The RSI indicator tends to be short-term – based on historical data over the past 40 years, the market typically drops within two weeks after the RSI Sell signal.
The second reason is rising inflation and market yields, which will likely continue. As I described in my previous article, rising inflation and interest rates/yields are a likely trigger for a market turn, and inflation is poised to jump substantially as soon as this week.
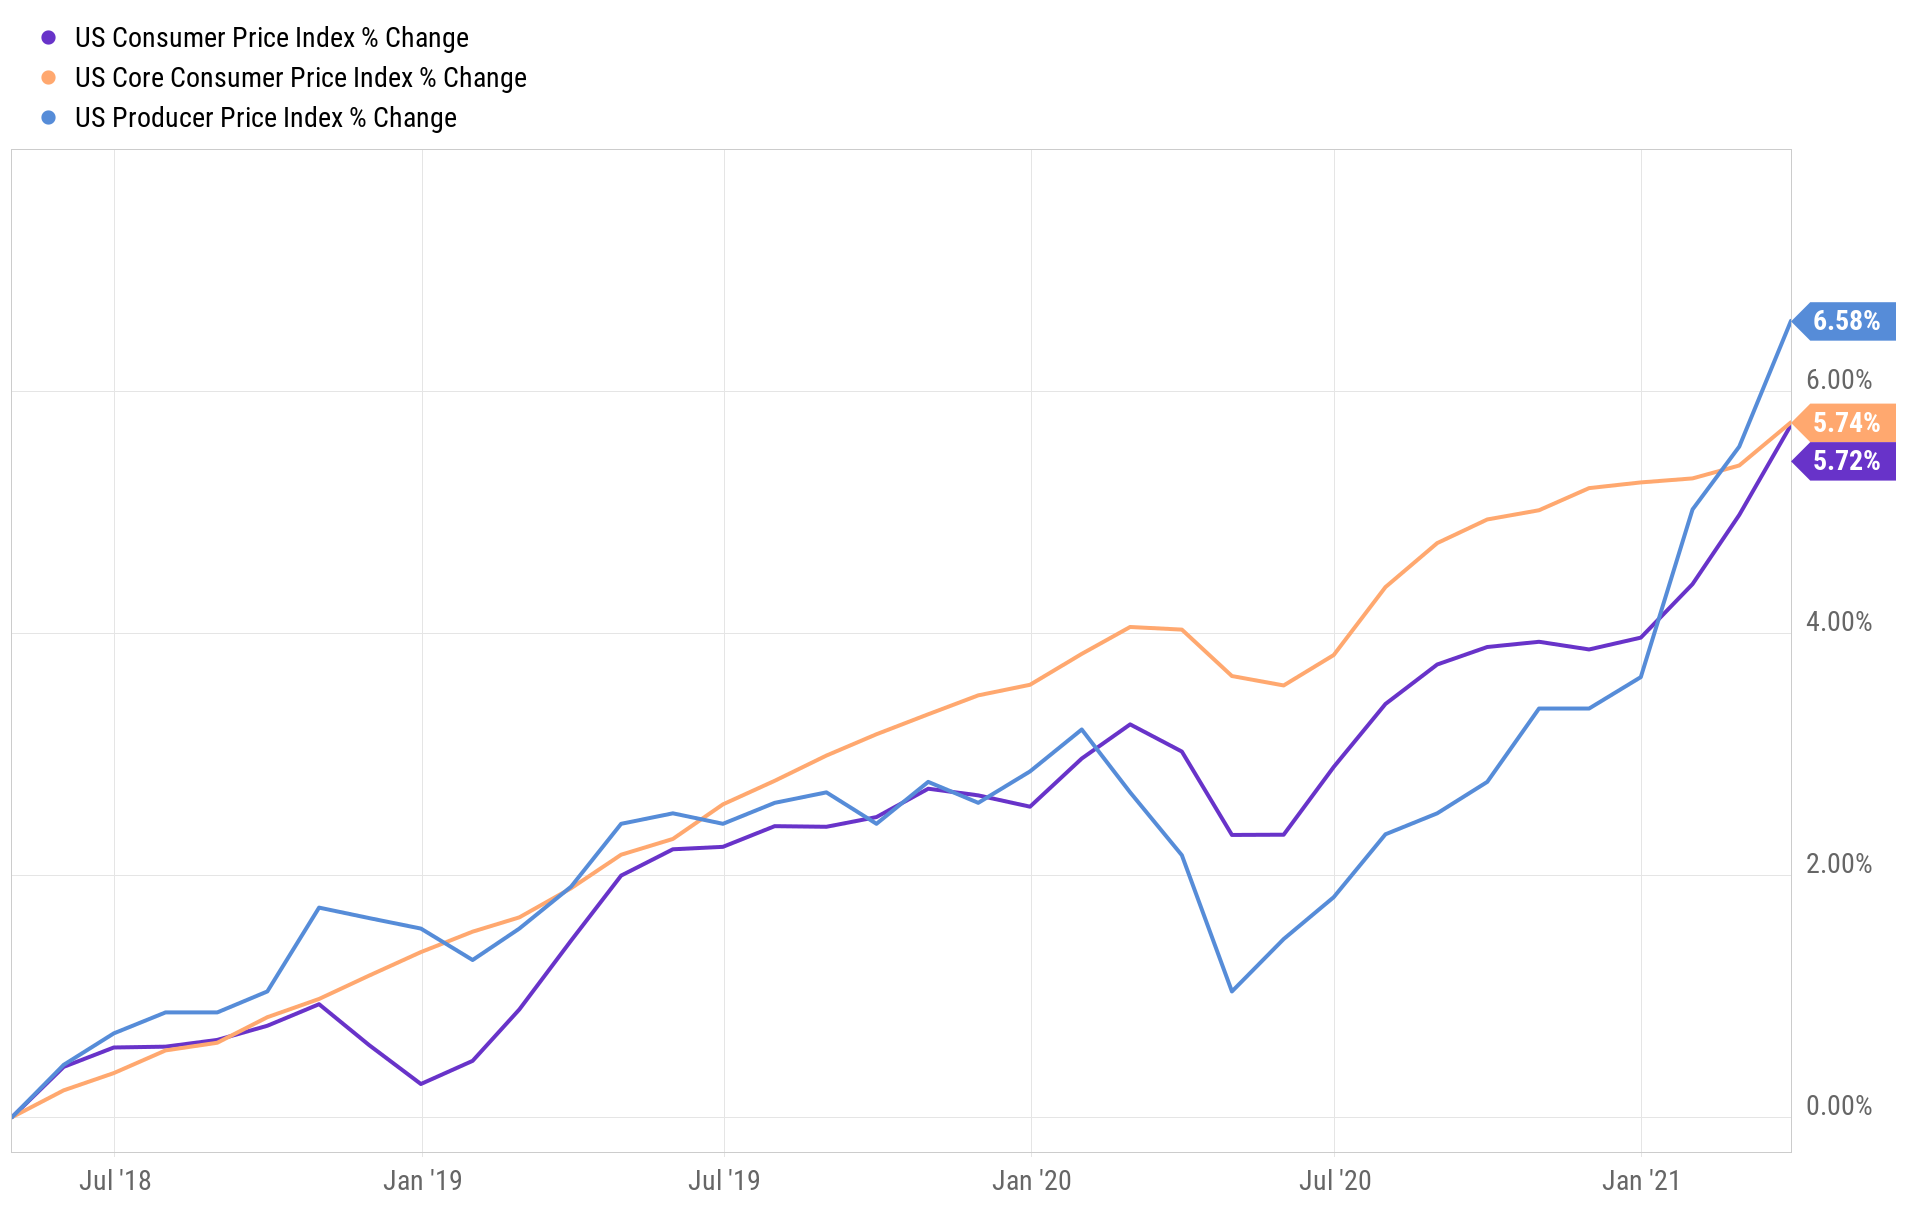
The rally in commodities in the past year pushed the producer price index (PPI, the light-blue line on the chart below) to 4.2%, its highest in 10 years. This began to filter into consumer inflation (CPI, the yellow line), at 2.6%. You can recognize the progression of rising inflation rates, from commodities to PPI to core CPI, on the chart below. Core CPI inflation (which excludes food and energy) is still low at 1.6%, but is likely to rise as high material prices impact consumer prices. In addition, the same policies that triggered the rally in commodities will also likely push wages up.
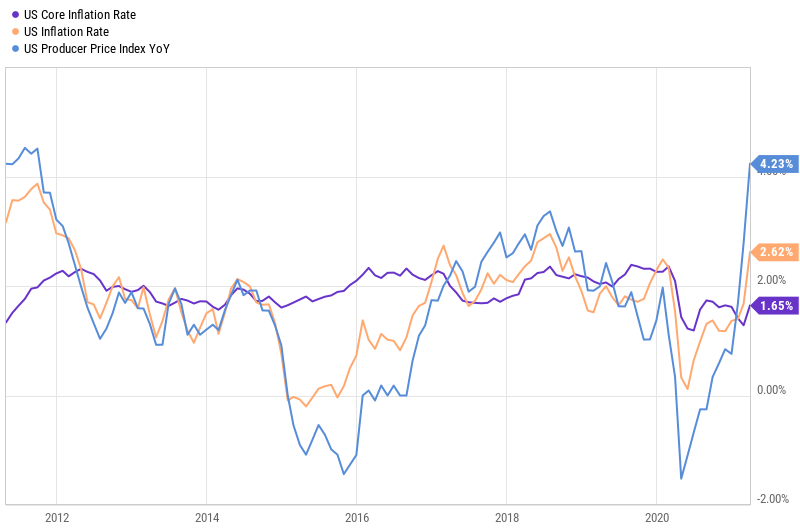
Source: Ycharts.com
Below are additional 10-year charts that illustrate the magnitude of the commodity rally. Lumber is the most extreme, with its price now 3-5 times the highest levels seen in 40 years of available history. Most other commodities – for example industrial metals (copper, iron) and foodstuffs (soybeans, wheat, pork) – rose sharply in the past year to 10-year or all-time highs. The CRB Commodity Index is up 70% in the past 12 months, and the CRB Non-Energy index is up 50%. These high raw-material prices will likely cause end-product prices to rise. And there’re no sign that higher prices will lead to higher production – the current government’s policies appear to have triggered mutually-reinforcing production shortages and rising prices.
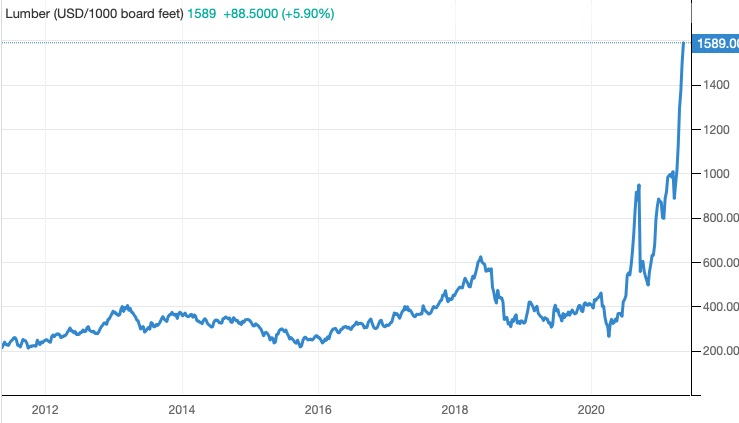
Source: Tradingeconomics.com
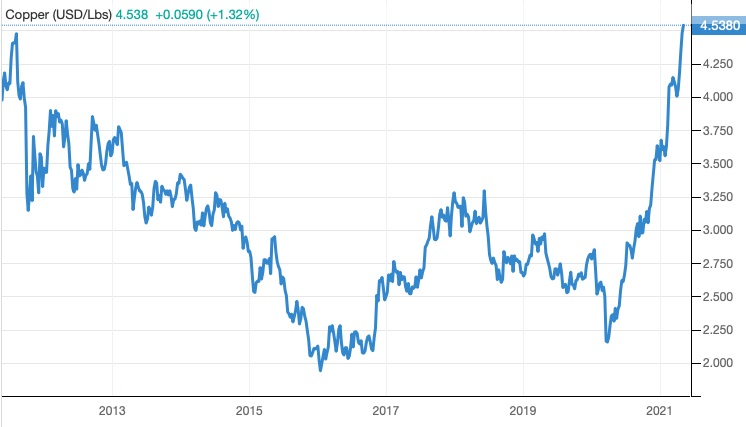
Source: Tradingeconomics.com
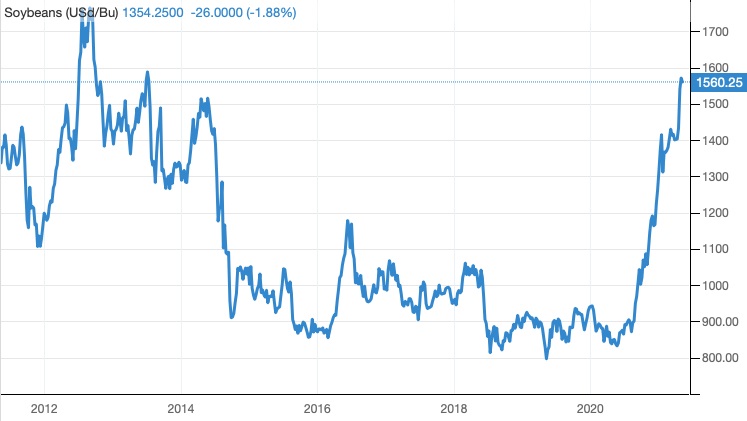
Source: Tradingeconomics.com
The second reason I think the end is near is that inflation rates will jump again this week due to the “base effect” – the dip that occurred last year (see chart below). It’s now clear that inflation has accelerated in recent months (seen on the chart by inflation indexes “turning up” in recent months), well beyond the base effect – but the jump will likely generate headlines. The dates to watch for on this are this Wednesday, May 12th (CPI, consensus is 3.6%) and Thursday, May 13th (PPI, might reach as high as 6%).
Source: Ycharts.com
Market Outlook
The 6-month outlook for the S&P 500 by our fundamentals-based statistical Equity Model decreased again in April. Higher market valuation and factor rebalancing accounted for the change. The outlook continues to indicate “Negative Fundamentals.”
About Model Capital Management LLC
Model Capital Management LLC (“MCM”) is an independent SEC-registered investment advisor, and is based in Wellesley, Massachusetts. Utilizing its fundamental, forward-looking approach to asset allocation, MCM provides asset management services that help other advisors implement its dynamic investment strategies designed to reduce significant downside risk. MCM is available to advisors on AssetMark, Envestnet, SMArtX, and other SMA/UMA platforms, but is not affiliated with those firms.
Notices and Disclosures
- This research document and all of the information contained in it (“MCM Research”) is the property of MCM. The Information set out in this communication is subject to copyright and may not be reproduced or disseminated, in whole or in part, without the express written permission of MCM. The trademarks and service marks contained in this document are the property of their respective owners. Third-party data providers make no warranties or representations relating to the accuracy, completeness, or timeliness of the data they provide and shall not have liability for any damages relating to such data.
- MCM does not provide individually tailored investment advice. MCM Research has been prepared without regard to the circumstances and objectives of those who receive it. MCM recommends that investors independently evaluate particular investments and strategies, and encourages investors to seek the advice of an investment adviser. The appropriateness of an investment or strategy will depend on an investor’s circumstances and objectives. The securities, instruments, or strategies discussed in MCM Research may not be suitable for all investors, and certain investors may not be eligible to purchase or participate in some or all of them. The value of and income from your investments may vary because of changes in securities/instruments prices, market indexes, or other factors. Past performance is not a guarantee of future performance, and not necessarily a guide to future performance. Estimates of future performance are based on assumptions that may not be realized.
- MCM Research is not an offer to buy or sell or the solicitation of an offer to buy or sell any security/instrument or to participate in any particular trading strategy. MCM does not analyze, follow, research or recommend individual companies or their securities. Employees of MCM may have investments in securities/instruments or derivatives of securities/instruments based on broad market indices included in MCM Research.
- MCM is not acting as a municipal advisor and the opinions or views contained in MCM Research are not intended to be, and do not constitute, advice within the meaning of Section 975 of the Dodd-Frank Wall Street Reform and Consumer Protection Act.
- MCM Research is based on public information. MCM makes every effort to use reliable, comprehensive information, but we make no representation that it is accurate or complete. We have no obligation to tell you when opinions or information in MCM Research change.
- MCM DOES NOT MAKE ANY EXPRESS OR IMPLIED WARRANTIES OR REPRESENTATIONS WITH RESPECT TO THIS MCM RESEARCH (OR THE RESULTS TO BE OBTAINED BY THE USE THEREOF), AND TO THE MAXIMUM EXTENT PERMITTED BY LAW, MCM HEREBY EXPRESSLY DISCLAIMS ALL WARRANTIES (INCLUDING, WITHOUT LIMITATION, ANY IMPLIED WARRANTIES OF ORIGINALITY, ACCURACY, TIMELINESS, NON-INFRINGEMENT, COMPLETENESS, MERCHANTABILITY AND/OR FITNESS FOR A PARTICULAR PURPOSE).
- “Model Return Forecast” for 6-month S&P 500 return is MCM’s measure of attractiveness of the U.S. equity market obtained by applying MCM’s proprietary statistical algorithm and historical data, but is not promissory, and, by itself, does not constitute an investment recommendation. Model Return Forecasts were calculated and applied by MCM to its research and investment process in real time beginning from 2012. For periods prior to Jan 2012, the results are “back-tested,” i.e., obtained by retroactively applying MCM’s algorithm and historical data available in Jan 2012 or thereafter. Source for the S&P 500 actual returns: S&P Dow Jones.
- Index returns referenced in MCM Research, if any, are gross of any advisory fees, fund management fees, and trading expenses. Fund or ETF returns referenced, if any, are gross of advisory fees and trading expenses. Returns will be reduced by fees and expenses incurred.
