
By Roman Chuyan, CFA
- Our Equity Model’s 6-month forecast for the S&P 500 turned significantly negative on economic factors and record market valuation.
- Along with our Short-Term Risk model, this dictates defensive positioning.
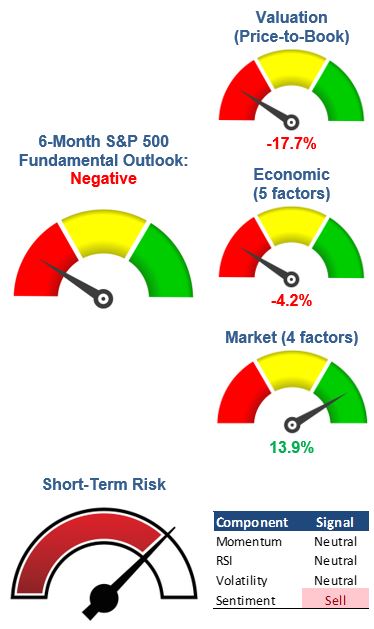
Our 6-month Equity Model turned significantly negative at ‑7.9% in January on economic factors. The economic component of the model dropped sharply and turned negative this month, to -4.2% (see Market Outlook). In addition, market valuation has risen to extremely overvalued levels.
Congress passed over $3 trillion of deficit spending in 2020 to fight the effect of the pandemic. GDP rebounded sharply in Q3 and ended the year down less than 4%, but this rebound was mostly a result of the stimulus money. Consumer sentiment stayed at recession levels, suggesting that people don’t feel much better off financially:
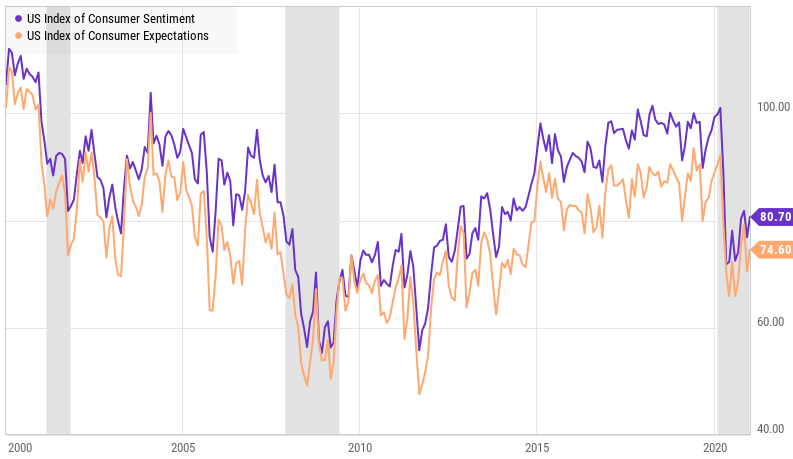
Source: Ycharts
Millions of Americans who lost their jobs last year remain unemployed, and jobless claims re-surged in December and January, reaching around 900,000 per week. Unlike the temporary layoffs in the midst of the first COVID wave last year, these appear to be permanent and include higher-paying jobs. Companies are laying off workers to cut costs in the post-pandemic economy.
To understand where we are, let’s take a brief trip into history. The Fed traditionally lowered Interest rates by an average of 5% to tackle recessions through commercial bank lending. Each recession required lower rates, until the Fed had to drop the rate to 1% to spur growth after the 2001-02 recession (see chart below). In 2008 it dropped the rate to zero, but that wasn’t enough. The Fed then began creating money directly by buying bonds (the Fed buying anything creates money). Its balance sheet rose from $900 billion in early 2008 to $4.5 trillion in 2014 – a fivefold increase. The Fed’s post-2008 money-creation inflated stocks, bonds, and real estate.
In addition to the $3 trillion in federal deficit spending on stimulus, the Fed created another $3.2 trillion in 2020 by bond-buying. That wasn’t enough. Another $1.9 trillion in spending was just proposed by the Biden administration. And, that probably won’t be the end of it. As some other observers, I am becoming convinced that deficit spending and the Fed’s money creation have reached a point of no return.
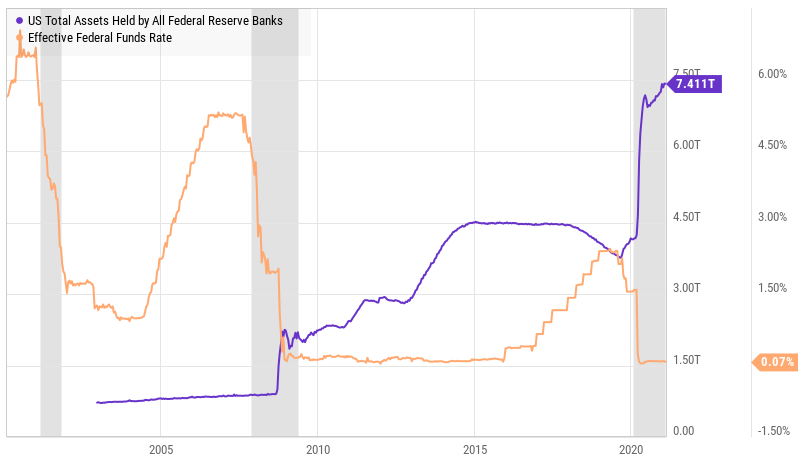
Source: Ycharts
Are stocks in a bubble? As I’ve written here before, earnings and book-value multiples are at historical extremes. For example, Shiller’s P/E ratio is at its highest in 150 years except for the dot-com peak in 1999-2000. It’s much higher now than it was in in 2019 (before last year’s plunge), in 2007 (before the 2008-09 bear market), and even in 2029 (before the Great Depression).
Shiller P/E Ratio, 150 Years

Source: Robert Shiller
Today, I’d like to mention a telltale sign of a bubble: reckless speculation. In 2000, it was dot-com companies with no revenue. In 2007 it was sub-prime “liar’s loans” – mortgages that didn’t require any proof of a job, income, or assets.
We just witnessed the stock of money-losing company GameStop jumping 15-fold in two weeks driven by a Reddit forum. AMC, Blackberry, and many others also experienced exponential jumps. These money-losing companies had been favorites to short among hedge funds, and experienced a short squeeze when the buying began. My point is, this is more of the same speculative frenzy that characterizes every bubble.
GameStop and AMC pale in comparison to the current penny-stock mania. Numerous penny-stock companies with no revenue and hardly any operations skyrocketed hundreds (some thousands) of times to reach billions in market capitalization. They look exactly the same as dot-coms in 2000. These are warning signs that happen near the peak of a bubble. From its 2000 peak to bottom in 2002, the NASDAQ lost about 77% of its value.
You’d think that institutions and hedge funds would carefully manage risk in this environment. Instead, they’re happy participants, with risk near its highest in years (see chart). When the bubble busts, these institutions will be scrambling to get out, elbowing individual investors.
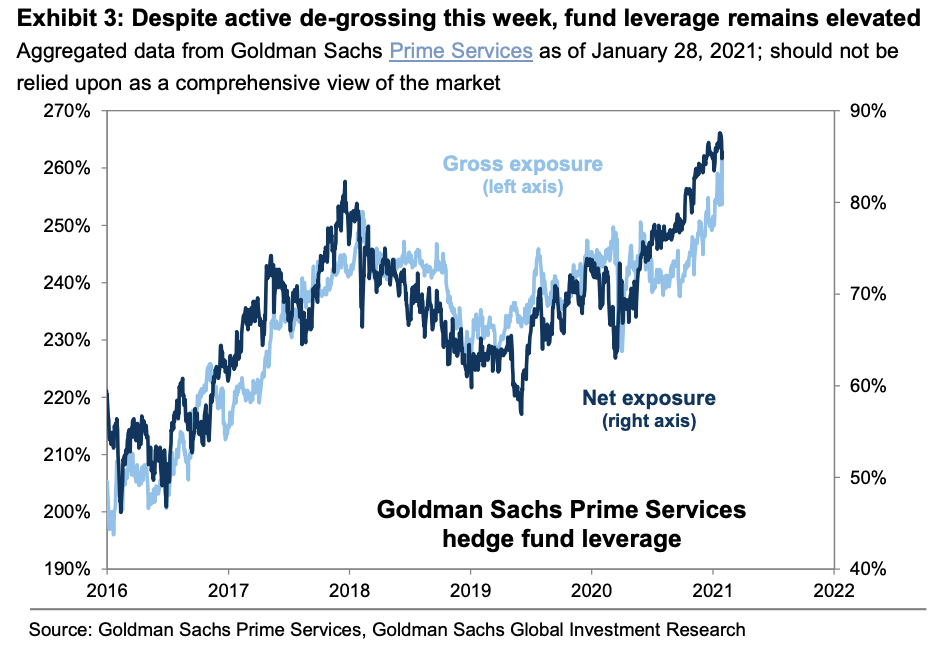
Source: Goldman Sachs
We think it’s prudent to be careful with taking risk in this market. It’s difficult to know when exactly the bubble will burst – it might be soon or it might continue for a while longer. We’re not guessing; instead, we use our models to determine the market direction and guide our process. We think the negative shift in our 6-month Equity Model indicates that a turn is getting closer.
Market Outlook
 The 6-month outlook for the S&P 500 by our fundamentals-based statistical Equity Model dropped sharply in January. Economic factors accounted for most of the decline, most notably Consumer Expectations. As the forecast drops below -5%, its effect in our investment process changes to “Negative Fundamentals.”
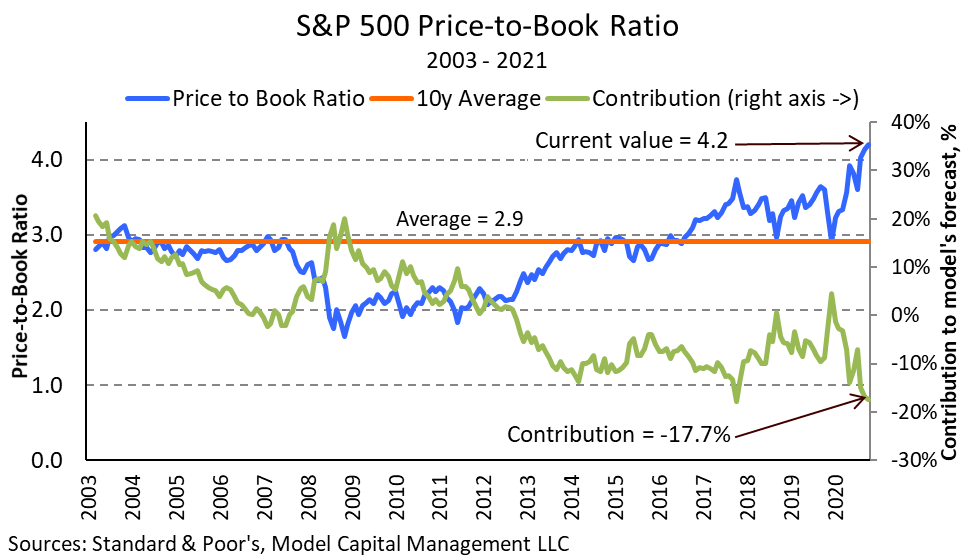
The Price-to-Book Ratio remained elevated in January, at 4.2 – up from 4.14 in December and near its highest point since 2001. The effect of this factor in the model decreased further this month to ‑17.7%, indicating that the stock market is extremely overvalued.
The overall effect of the Economic category dropped sharply and turned negative in January, to -4.2% from 5.1% last month. Continued weakness in Consumer Expectations accounted for most of the drop (-4.6%), followed by the rising commodity CRB Index (-2.9%) and other factors.
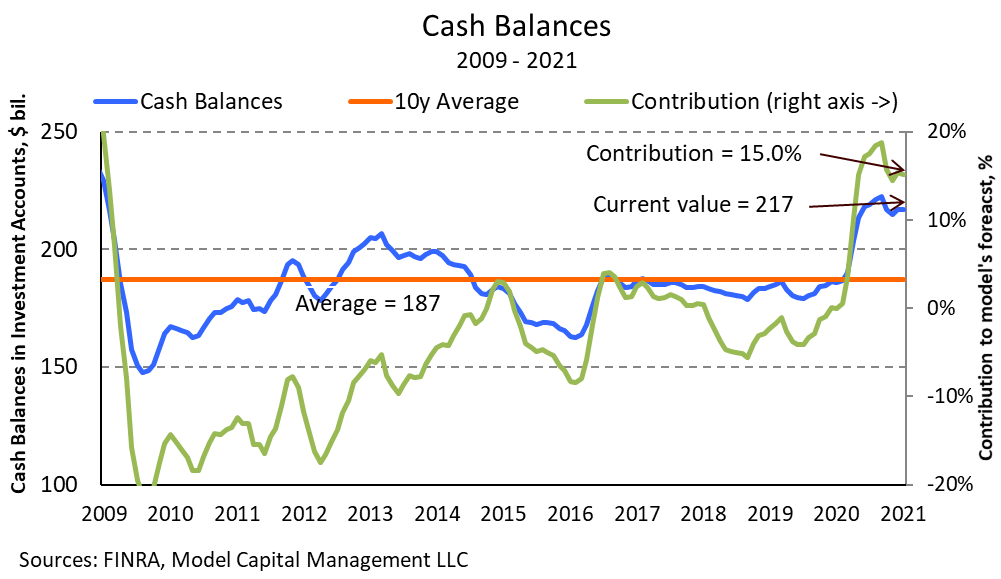
The overall effect of Market factors decreased by 2.3% in January to 13.9%, but remains highly positive. The effect of Cash Balances continues to be the largest positive factor in the model as retail investor cash balances remain high.
Our Short-Term Risk model looks for technical patterns that preceded previous sharp market declines. The model’s contrary Investor Sentiment component gave a Sell signal on Nov 18, 2020 as sentiment reached exuberant levels. This signal can last for up to three months.
Some of the Equity Model’s most negative and positive factors are shown below in historical context (assuming their current weights). The S&P 500 Price-to-Book Ratio, at 4.2, remains near its 20-year high, up from 3.6 three months ago. The contribution of this factor, at -17.7%, continues to indicate that the market is extremely overvalued.
Investors’ Cash Balances remain elevated. The effect of this factor, at 15.0%, continues to be the most positive in our model. We believe that individual investors redeploying the cash was behind the rise in stocks in the past three months – a purely momentum-driven market.
About Model Capital Management LLC
Model Capital Management LLC (“MCM”) is an independent SEC-registered investment advisor, and is based in Wellesley, Massachusetts. Utilizing its fundamental, forward-looking approach to asset allocation, MCM provides asset management services that help other advisors implement its dynamic investment strategies designed to reduce significant downside risk. MCM is available to advisors on AssetMark, Envestnet, SMArtX, and other SMA/UMA platforms, but is not affiliated with those firms.
Notices and Disclosures
- This research document and all of the information contained in it (“MCM Research”) is the property of MCM. The Information set out in this communication is subject to copyright and may not be reproduced or disseminated, in whole or in part, without the express written permission of MCM. The trademarks and service marks contained in this document are the property of their respective owners. Third-party data providers make no warranties or representations relating to the accuracy, completeness, or timeliness of the data they provide and shall not have liability for any damages relating to such data.
- MCM does not provide individually tailored investment advice. MCM Research has been prepared without regard to the circumstances and objectives of those who receive it. MCM recommends that investors independently evaluate particular investments and strategies, and encourages investors to seek the advice of an investment adviser. The appropriateness of an investment or strategy will depend on an investor’s circumstances and objectives. The securities, instruments, or strategies discussed in MCM Research may not be suitable for all investors, and certain investors may not be eligible to purchase or participate in some or all of them. The value of and income from your investments may vary because of changes in securities/instruments prices, market indexes, or other factors. Past performance is not a guarantee of future performance, and not necessarily a guide to future performance. Estimates of future performance are based on assumptions that may not be realized.
- MCM Research is not an offer to buy or sell or the solicitation of an offer to buy or sell any security/instrument or to participate in any particular trading strategy. MCM does not analyze, follow, research or recommend individual companies or their securities. Employees of MCM may have investments in securities/instruments or derivatives of securities/instruments based on broad market indices included in MCM Research.
- MCM is not acting as a municipal advisor and the opinions or views contained in MCM Research are not intended to be, and do not constitute, advice within the meaning of Section 975 of the Dodd-Frank Wall Street Reform and Consumer Protection Act.
- MCM Research is based on public information. MCM makes every effort to use reliable, comprehensive information, but we make no representation that it is accurate or complete. We have no obligation to tell you when opinions or information in MCM Research change.
- MCM DOES NOT MAKE ANY EXPRESS OR IMPLIED WARRANTIES OR REPRESENTATIONS WITH RESPECT TO THIS MCM RESEARCH (OR THE RESULTS TO BE OBTAINED BY THE USE THEREOF), AND TO THE MAXIMUM EXTENT PERMITTED BY LAW, MCM HEREBY EXPRESSLY DISCLAIMS ALL WARRANTIES (INCLUDING, WITHOUT LIMITATION, ANY IMPLIED WARRANTIES OF ORIGINALITY, ACCURACY, TIMELINESS, NON-INFRINGEMENT, COMPLETENESS, MERCHANTABILITY AND/OR FITNESS FOR A PARTICULAR PURPOSE).
- “Model Return Forecast” for 6-month S&P 500 return is MCM’s measure of attractiveness of the U.S. equity market obtained by applying MCM’s proprietary statistical algorithm and historical data, but is not promissory, and, by itself, does not constitute an investment recommendation. Model Return Forecasts were calculated and applied by MCM to its research and investment process in real time beginning from 2012. For periods prior to Jan 2012, the results are “back-tested,” i.e., obtained by retroactively applying MCM’s algorithm and historical data available in Jan 2012 or thereafter. Source for the S&P 500 actual returns: S&P Dow Jones.
- Index returns referenced in MCM Research, if any, are gross of any advisory fees, fund management fees, and trading expenses. Fund or ETF returns referenced, if any, are gross of advisory fees and trading expenses. Returns will be reduced by fees and expenses incurred.
