
Looking forward, we maintain our view on the attractiveness of Emerging Markets relative to Developed Market assets for three key reasons. First, Emerging Market economies have higher population growth, 1.4% annualized from 2005 to 2015, compared to Developed Market Economies, 0.9% annualized from 2005 to 20151.
Assuming that population growth is directly related to labor growth, and increasing labor growth increases the gross domestic output of a given economy, then an equity investor would prefer to own higher growth, all other things being equal. Second, the equity markets of the individual, Emerging Market countries exhibit a lower overall correlation to the S&P 500 index compared to equity markets of the individual Developed Market countries.
This fact suggests that equity markets from Emerging Market countries could provide a portfolio diversification benefit. Finally, as shown in Figure 3, the valuation gap between Emerging Market equities and U.S. equity markets remains compelling.
Shown in figure 3 is the price-to-book ratio, a widely used valuation metric, for both the S&P 500 and the MSCI Emerging Market index rolling through time. The valuation gap has continued to widen since late 2010 and is currently at the most stretched level over the past ten years. Valuations alone, however, do not tell the complete story as one should consider whether profitability has changed.
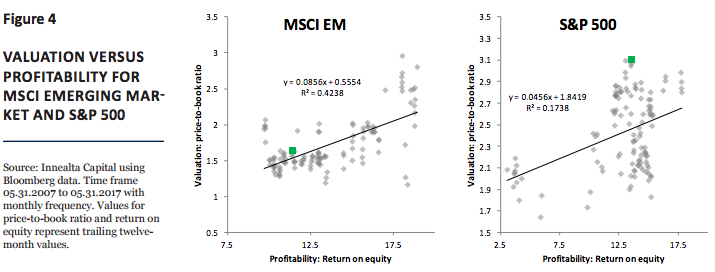
In Figure 4, we compare the price-to-book ratio (valuation) versus the return on common equity (profitability) of the MSCI Emerging Market index and the S&P 500 index. The green dot in each graph represents the values as of 05.31.2017. The relationship in each graph empirically shows that as profitability has increased, so has valuations. In our opinion, this makes economic sense. The graphs also highlight a significant divergence.
In the MSCI Emerging Market case, the current value is only slightly above the best-fit line. However, in the S&P 500 index case, the current value is significantly above the best-fit line. Said differently and based only on the empirical relationship between valuation and profitability, the MSCI Emerging Market index is neither over- nor undervalued while the S&P 500 is significantly overvalued.
Summary
Despite the current low volatility in financial markets, we continue to find attractive opportunities. The strong results from U.S. corporate Q1 earnings and the increasing expectations of future earnings helped to support the year-over-year performance in U.S. equity markets.
Within U.S. equity markets, “Trump” investment themes continue to underperform in 2017 despite a strong performance in 2016. Outside of U.S. markets, volatility in Emerging Markets provided an occasion to increase our overweight, and we remain convicted in our preference for Emerging Market assets relative to Developed Market assets.
This article was written by Innealta Capital, a participant in the ETF Strategist Channel.
Disclosure Information
The information provided comes from independent sources believed reliable, but accuracy is not guaranteed and has not been independently verified. The security information, portfolio management and tactical decision process are opinions of Innealta Capital (Innealta), and the performance results of such recommendations are subject to risks and uncertainties. Past performance is not a guarantee of future results. Any investment is subject to risk. Exchange traded funds (ETFs) are subject to risks similar to those of stocks, such as market risk, and investors that have their funds invested in accordance with the portfolios may experience losses. Additionally, fixed income (bond) ETFs are subject to interest rate risk which is the risk that debt securities in a portfolio will decline in value because of increases in market interest rates. The value of an investment and the return on invested capital will fluctuate over time and, when sold or redeemed, may be worth less than its original cost. This material is not intended as and should not be used to provide investment advice and is not an offer to sell a security or a solicitation or an offer, or a recommendation, to buy a security. Investors should consult with an investment advisor to determine the appropriate investment vehicle. Investment decisions should be made based on the investor’s specific financial needs and objectives, goals, time horizon and risk tolerance. All opinions and views constitute our judgments as of the date of writing and are subject to change at any time without notice. Chart Definitions S&P 500 refers to the S&P 500 Index (Large Cap Equity), which measures the performance of the large capitalization sector of the U.S. equity market and is considered one of the best representations of the domestic economy. Industrials refers to the S&P 500 Industrials Index, which comprises those companies included in the S&P 500 that are classified as members of the GICS industrials sector. Financials refers to the S&P 500 Financials Index, which comprises those companies included in the S&P 500 that are classified as members of the GICS financials sector. The Russell 2000 Index (Small Cap Equity) measures the performance of the small-cap segment of the U.S. equity universe and is comprised of the smallest 2000 companies in the Russell 3000 Index. The MSCI Emerging Markets Index captures large and mid cap representation across 23 Emerging Markets (EM) countries. It is not possible to invest directly in an index. AFAM Capital, Inc. is a registered investment adviser. Al Frank Asset Management and Innealta Capital are divisions of AFAM Capital. AFAM is the investment advisor to individually managed client accounts and certain mutual funds. For more information, please visit afamcapital.com. Registration as an investment advisor does not imply any certain level of skill or training. Innealta is an asset manager specializing in the active management of portfolios of ETFs. Contact your financial advisor for additional information. 191-AFAM-6/2/2017
