
It has been our experience that investors pursuing “market-beating” returns largely overlook what is perhaps the single most reliable way to achieve investment outperformance over the long term.
The method is simple, and it works by exploiting an inescapable mathematical fact about the capital markets — a phenomenon that has been called the asymmetry of returns. The method, which can be characterized as winning by losing less, is accessible to investors of all types and sizes. But it requires a deep appreciation for return asymmetry, and the patience to let this phenomenon work for you over complete market cycles.
What is return asymmetry?
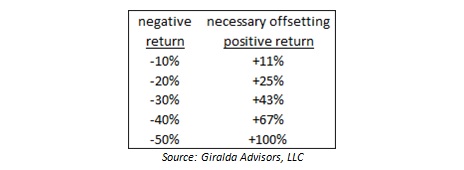
Here’s an example. If you start with $100, a -10% decline (to $90) requires a subsequent +11% gain ($100/$90 – 1) to get back to break-even. Every ‐1% decline requires greater than a +1% recovery to get the investor back to where he/she started. This phenomenon occurs for declines of any size. In fact, the larger the percentage decline, the more pronounced the asymmetry, as the table below shows.
A key takeaway from this is that, in terms of percentage returns, it is more valuable to avoid a decline than it is to capture an advance of the same magnitude. Put another way, avoiding a loss is the economic equivalent of capturing a gain of even greater magnitude. It should be clear that this has major ramifications for a successful long-term investment strategy.
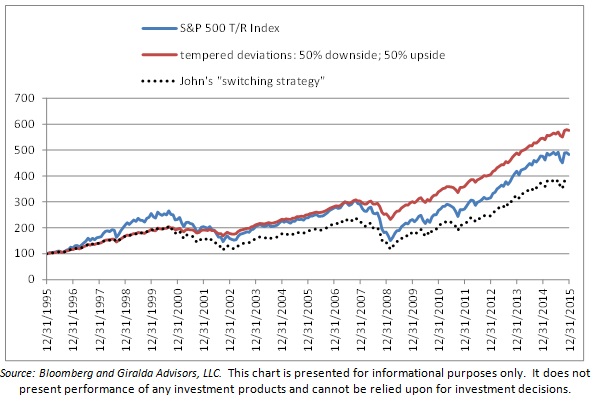
If this implication is not clear, the following demonstration may help. Let’s use the S&P 500 Index to make the point, though any index with peaks and troughs (i.e., just about any capital markets index) would do. In the graph below, we plot (in blue) the monthly total return of the S&P 500 Index over the last 20 years, ending 12/31/2015. The average monthly return of the S&P 500 Index over this period was 0.76%; its monthly standard deviation was 4.42%. We also plot (in red) the S&P 500 Index if we temper by 50% both the upside and downside monthly deviations from the average monthly return. The average monthly return of this tempered index remains 0.76%; but its standard deviation is now 2.21%, half the original. [Technical note: This latter index is not an “investable index” as it depends on measures (such as standard deviation) that can be known with certainty only in retrospect; but it is a relevant and useful model for this conceptual demonstration, since its behavior reflects the goal of many portfolio risk management strategies.] So, what are we attempting to show with this demonstration? We are looking to directly measure the added value opportunity presented by return asymmetry. Specifically, by tempering both advances and declines by the same degree, while keeping the average monthly return unchanged, we are able to calibrate the improvement in long-term wealth attributable solely to exploiting the asymmetry of returns.
 Let’s make a few observations from this demonstration
First, an investment that behaved like the tempered index would have resulted in substantially more wealth over the 20-year period, relative to the S&P 500 Index. Second, the outperformance is entirely attributable to periods when the S&P 500 Index is in decline. A corollary to this second observation is that, when the S&P 500 is steadily rising, the tempered index falls significantly behind. In fact, we started the comparison in the mid-1990s to highlight this fact — through mid-2000, the tempered index grows by only 98% cumulatively, while the untempered S&P 500 grows 154%.
Suppose, in mid-2000, John, an investor with results similar to this tempered index, became so disenchanted with his perceived opportunity cost over the first 4.5 years that he abandoned his risk-managed portfolio in favor of one that simply followed the untempered index. His subsequent return over the next 15.5 years would have been a cumulative 90%. Meanwhile his sister, Jane, who stayed faithful to the risk-managed approach, enjoyed a cumulative return of 191% over the same period. And Jane, of course, ended up much wealthier after the full 20 years, having seen a cumulative growth of 476%, compared to her brother’s 276%. In dollar terms, John grew his original $100,000 portfolio to $376,000 (see dotted line path on graph above), while his steadfast sister, who also started with $100,000, grew her portfolio to $576,000 (see red solid line path on graph above). John got in his own way and deserted a proven, time-tested risk management approach simply because it wasn’t needed, in retrospect, over the short term.
We noted how, through the first 4.5 years, i.e., from 1/1/1996 through 06/30/2000, an investment in the non-risk-managed S&P 500 Index would have done better. This will typically be the case when the untempered index is in relentless upswing. We have seen recent examples of investors who have grown impatient with risk-managed investing when facing a similar situation. That is why this approach rewards only those investors who have the patience and fortitude to see it through a complete market cycle and rewards such investors further through each subsequent cycle.
So, a portfolio risk management device that mitigates extreme percentage movements can lead to greater wealth creation over time than a portfolio without such a device. Are there such devices in practice? We will discuss several practical approaches in subsequent articles.
These approaches constitute a class of strategies that we call Risk-Managed Investing, or RMI, which we introduced in (Article One) and further discussed in later installments (Article Two, Article Three, Article Four). Each RMI strategy attempts to mitigate downside risk, and each has a cost, which directly or indirectly sacrifices some upside potential. Some RMI approaches are more cost-effective than others in this regard.
In our next installment, we will address a question to which the above discussion logically leads: How much market upside should you be willing to give up to achieve a given level of downside risk mitigation?
For now, the thought we would like to leave you with is this… RMI has the potential to be a powerful wealth-building tool for those investors with the foresight to appreciate its potency and the patience to let it work for them.
Please let us hear your comments.
This article was written by the team at Giralda Advisors, a participant in the ETF Strategist Channel.
This material is for informational purposes only. Nothing in this material is intended to constitute legal, tax, or investment advice. Investing involves risk including potential loss of principal.
Giralda Advisors, located in New York City, is an asset management firm that focuses on providing risk-managed exposure to the equity markets with a goal of limiting asset depreciation during both protracted and catastrophic market downturns while allowing substantial asset appreciation in up-trending markets. The Giralda Advisors team welcomes your inquiries. Please call (212) 235-6801 or visit us at http://www.giraldaadvisors.com/
