
Notice the very powerful result of this straightforward difference in methodology. The additive approach, as one would expect, certainly overweights stocks that score more highly across the five factors. It also underweights those that score below the median (2.5) – but it does so in a relatively conservative manner. Its biggest overweight is 2.2 times the starting market capitalization weight. So, on the stock that it favors the most, the additive approach is prepared to go from, say, 0.10% to 0.22%.
Contrast that to the multiplicative approach. On the exact same stock – the one that has the best combined five factor score – a tilt approach is prepared to overweight by 26.6 times. So it would take that same initial 0.10% starting weight and move it to 2.6%, a position that is around twelve times the size of the additive approach.
And note that this is broadly true of high-scoring stocks in general. As their scores increase, a multiplicative approach starts to become increasingly aggressive in its conviction (which explains the sharp shift to the right in the plot). Of course, this conviction probably comes at the cost of a higher tracking error, given that the weightings are moving further from market cap on average. And so, as with all investing, one needs to consider that trade-off. Ultimately though, this “conviction level” is a key difference between these methodologies, and investors must decide which they prefer. (After all, an alpha of 2% and a tracking error of 2% gives the same ratio as an Alpha of 5% and a tracking error of 5%, but they are clearly very different investments).
However, we would argue that, if a stock is being evaluated according to it scores on five factors that have demonstrated their ability to generate alpha in the long run, then the far more concentrated approach of the tilt methodology may be preferable to long term holders.
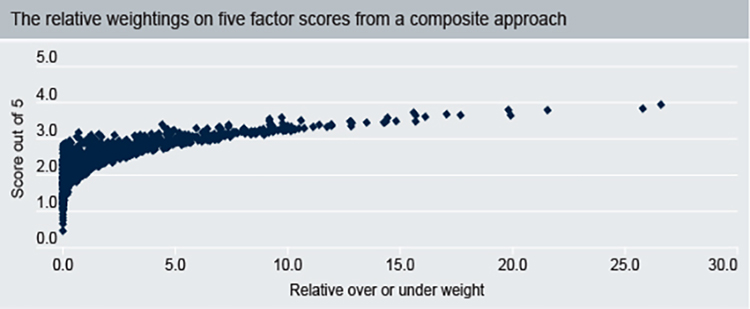
Source: FTSE Russell as of June 27, 2016 rebalance. This chart represents the relative over- or under-weights (compared to the market cap starting universe that a “composite,” or averaging approach puts on stocks with different factor scores).
The Bottom Line
There are many ways of combining factor exposures within a portfolio. Be sure to understand the process fully, and know the relative pros and cons of your chosen methodology.