
By Henry Ma, Julex Capital Management
Jeremy Grantham, one of the most notable “top-down” value investor, recently had a changing heart on value investing. In his widely-read quarterly newsletter titled “This Time Seems Very, Very Different”, he noticed the average P/E ratio of the S&P 500 after 1996 was 65% to 70% higher than the long term average. He attributed higher profit margin and lower interest rates to the higher P/E ratio, and concluded “it seems likely we will have a longer wait than any value manager would like (including me)” for “a more or less permanent move back to, or at least close to, the pre-1997 trends of profitability, interest rates and pricing.”
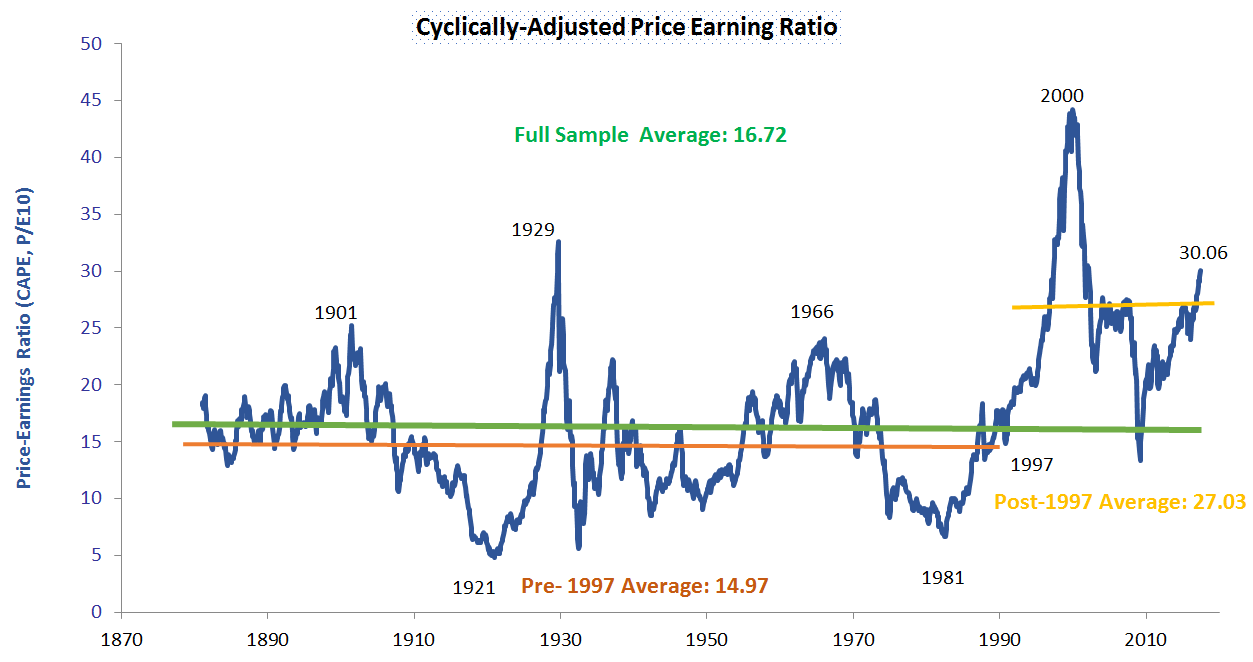
Figure 1 illustrates the historical cyclically-adjusted price earnings ratio (CAPE) since 1881. CAPE was calculated by Yale Professor Robert Shiller by using average earnings over a 10-year time frame instead of the trailing twelve-month earnings to remove the cyclicality of corporate earnings. Obviously, the post-1997 average CAPE is much higher than its pre-1997 level.
Figure 1: Cyclically-Adjusted Price Earnings ratio (Shiller PE)
Value investing, a strategy of buying cheap assets and capturing the excess returns when they recover eventually, relies on the mean reversion of asset valuation. The ‘top-down” value market timing approach practiced by Mr. Grantham calls for overweighting equities when their valuation is below mean (cheap) and under-weighing equities when their valuation is above mean (expensive). The approach will outperform a static asset allocation when the equity valuation reverts to its mean. An interesting question is: if the mean equity valuation becomes unstable over time, can it still serve as a robust timing indicator? To answer this question, we will test a simple timing strategy with Shiller PE as follows:
- When Current Shiller PE > (historical mean + one standard deviation), 100% of the portfolio is in T-Bills;
- When Current Shiller PE < (historical mean – one standard deviation), 100% of the portfolio is in S&P 500 Index;
- Otherwise, 50% is in S&P 500 Index and 50% is in T-Bills.
That means, when the market is overvalued by more than one standard deviation above the historical mean, the strategy over-weights T-bills. Conversely, when the market is undervalued by more than one standard deviation below the historical mean, the strategy over-weights equities. The benchmark for this strategy is a static portfolio of 50% S&P 500 and 50% T-Bills. The back test results are summarized in Table 1.
Table 1: Back Test Results of Timing Strategy with Shiller PE
| Timing Strategy with Shiller PE | Benchmark

|