
Factors ETFs had a roller coaster first quarter for many reasons.
Let’s take a look at how they did.
Roller Coaster QI for Factors
Equities experienced heightened volatility during the first quarter of 2018, with the S&P 500 Index surging 7.55% from Dec. 31 2017, through Jan. 26, 2018, before dropping nearly 8% through quarter-end.
Early in the quarter, market activity was buoyed by upward revisions to corporate profit outlooks following federal tax cuts in December, coupled with a squeeze on short volatility positions.
Related: Why the U.S. Debt Problem is Getting Worse
However, this momentum eased in the final two months of the quarter as investors became uneasy over a number of developments:
- The prospect of Internet regulations in the wake of Facebook privacy issues
- President Trump’s tweets about “anti-competitive” practices by online retailing giant Amazon
- Proposed US tariffs on steel and aluminum imports from China
- European Union threats to impose a 3% tax on online advertising revenues, goods and services
- A downgrade to the outlook for iPhone sales
- Concerns over tighter US monetary policy
The confluence of these events caused the CBOE Volatility Index (VIX) to spike nearly 81% during the first quarter, although high yield spreads were more contained — rising just 4.23% and hinting at a more benign risk picture.
Despite market jitters, economic activity was robust during the quarter — albeit somewhat late cycle in nature, given strong manufacturing numbers in the form of the ISM Manufacturing index, and a drop in the Citigroup Economic Surprise Index from near-record highs (detailed in the second table below).
Growth, small size, momentum factors outperform
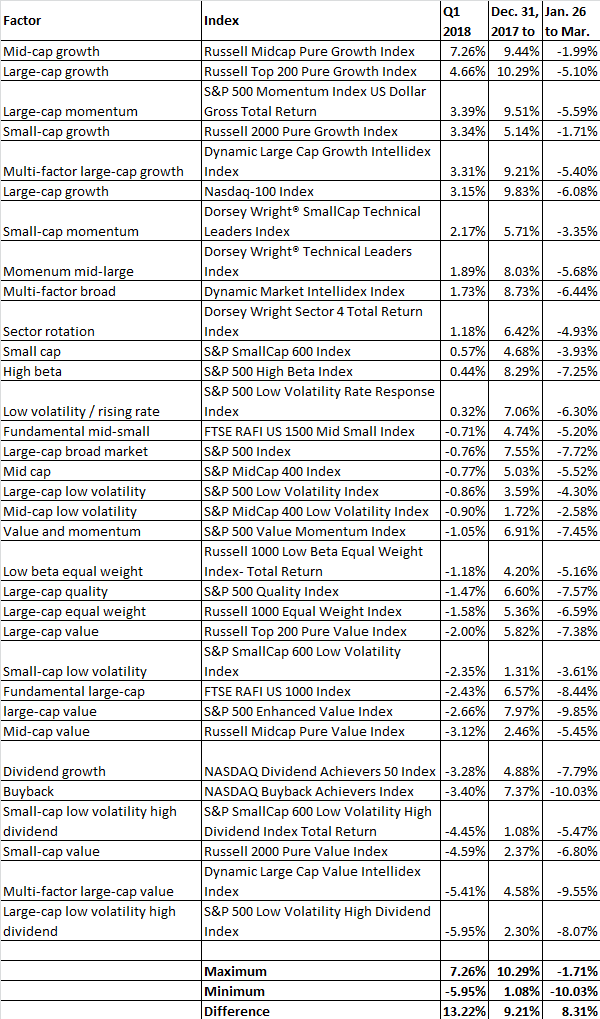
Aided by the strong US economy, growth, momentum and small size were the best-performing factors during the quarter. Many investors expected tax cuts to benefit smaller stocks, which were viewed as less likely to be affected by a potential trade war. Mid-cap shares performed especially well during the quarter. The Russell Midcap Pure Growth Index outpaced the S&P 500 Index on the strength of overweight positions in health care — particularly biotech — and technology.
Dividend yield, value factors underperform
On the other end of the spectrum, the value and dividend yield factors were among the worst performers during the quarter. Value was hurt by the poor performance of consumer staples companies and insurers, while dividend yield strategies were pressured by exposure to real estate — a sector not expected to benefit from tax reform — and an underweight position in consumer discretionary and technology shares.
Investment factor return dispersion was again notable during the quarter, with a 13.22% return spread between the best performer (mid-cap growth) and worst performer (large-cap low vol high dividend).
![]()
Low volatility factor provide cushion amid escalating volatility
The low volatility factor helped cushion the market’s decline late in the quarter. From Jan. 26 through quarter-end, the S&P 500 Low Volatility Index retreated 4.30%, while the S&P 500 Index fell 7.72%. The relative strength of low volatility was due in part to the overall drop in the equity market, and in part to heightened risk measures. VIX — a barometer of equity market volatility — jumped from 11.08 on Jan 26, 2018, to 19.97 at quarter-end, while high yield spreads, as defined by the Barcap US High Yield to Worst – 10-Year Treasury Spread Index, rose from 2.95% to 3.45% — underscoring a moderate increase in risk aversion.1
Yield spreads narrowed later in the quarter, as the US 10-year Treasury yield rose from 2.66% on Jan 26. to 2.74% at quarter-end. Despite an increase in short-term rates, low volatility provided 55.7% down capture during the quarter — meaning that it avoided nearly half of the broader market’s decline.1 This underscores my theory that interest rates are a not a primary driver of low volatility returns. In my view, risk levels and the overall direction of the equity market are far more relevant to the performance of low volatility.
Utilities, mid-cap performance pace low volatility returns
Because utilities are an important component of the S&P 500 Low Volatility Index, their performance was reflected in low volatility performance. Early in the quarter, utilities earnings estimates trended to the downside, while lower corporate tax rates diminished the value of the tax shield provided by debt financing. I believe rising interest rates hurt both the utilities and real estate sectors, which are sometimes viewed as bond proxies because of their yield potential. However, utilities gained ground after the market peaked on Jan. 26.
