

By David Haviland, Beaumont Capital Management
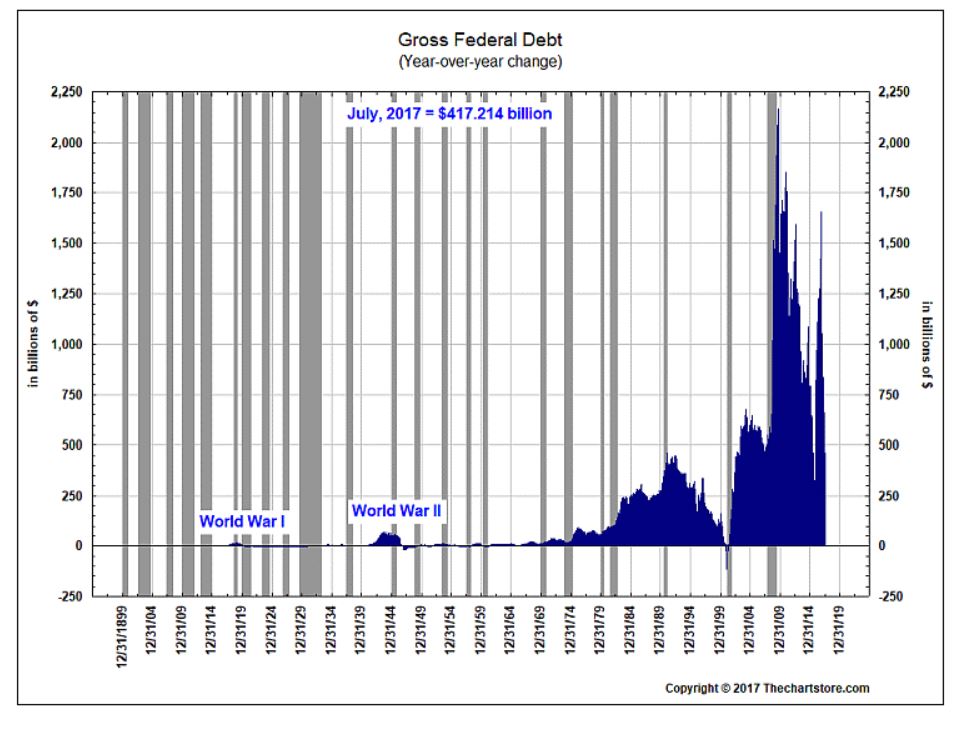
Regardless of your political views, Washington is spending money at a pace usually “reserved” for times of war. The chart below shows the U.S. Government’s year over year change in deficit spending.
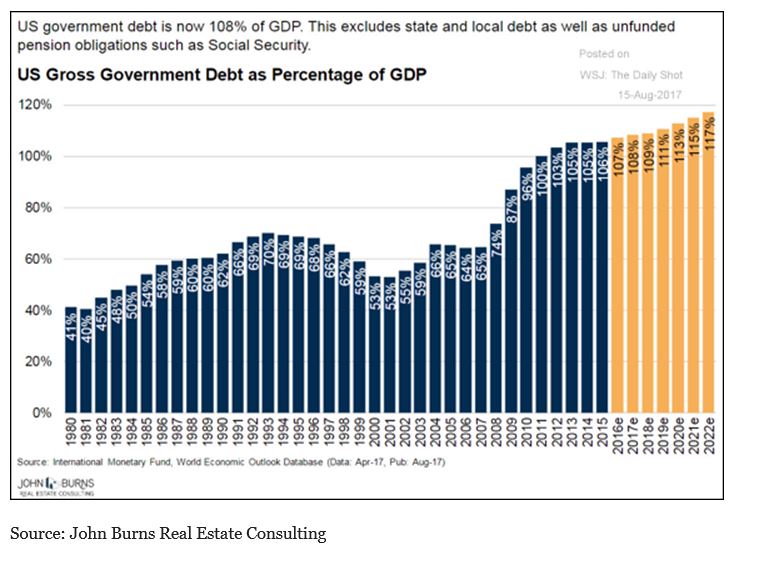
Looking at our debt in a different way, the following chart shows our Government’s debt as a percent of GDP and the predicted percentage increases for the next few years.
Why is this important? Well, the last two times our politicians decided to use the debt ceiling in a political context, chaos ensued. The following chart shows the Statutory debt limit and the debt outstanding.
