
By Joe Mallen and Chris Shuba, Helios Quantitative Research
This week’s drawdown is a spectacular example of markets doing what markets do – they occasionally have corrections. Market drawdowns are neither uncommon nor infrequent. When economic indicators are healthy, which they are, and the economy shows no sign of unusual disruptions (e.g., Brexit), then a correction should be viewed as a window of opportunity. In other words, now is the time to look for bargains.
So, What Happened?
To understand this week’s disruption, we need to recognize that extreme volatility occurred at critical points, such as basic moving averages and common stop-loss points. A drawdown of the type we just experienced is commonly known as a technical sell-off.
In the intraday chart of the S&P 500 Index from 2/2/2018 to 2/8/2018 below, notice that the Index was unusually volatile and fell during the latter half of the day on 2/5/2018 and on 2/8/2018, and in the absence of any adverse market data. We also see that the S&P 500 Index dropped quickly after reaching it’s 50-day moving average (top red line) and it’s 100-day moving average (bottom red line).
![]()
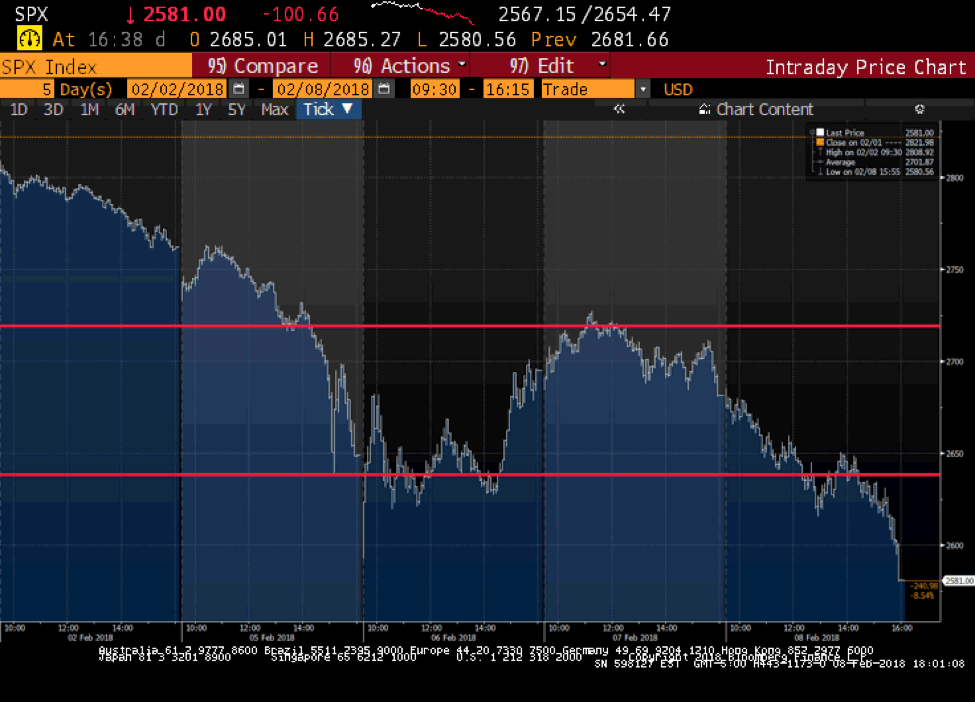
It is evident that algorithms had a hand in today’s volume, but the data does not suggest that high-speed systems were the sole cause of the drawdown.
What Causes Market Drawdowns?
Let me reiterate; market drawdowns are neither uncommon nor infrequent. Monday’s correction was substantial, but size is not the tell-tale sign of a correction. Size is, however, an indication of volatility, or perceived volatility.
Aside from the two infamous drawdowns that occurred during recessions (2002 and 2009), we have had 129 maximum peak drawdowns greater than -1% since 1988. See the image below:
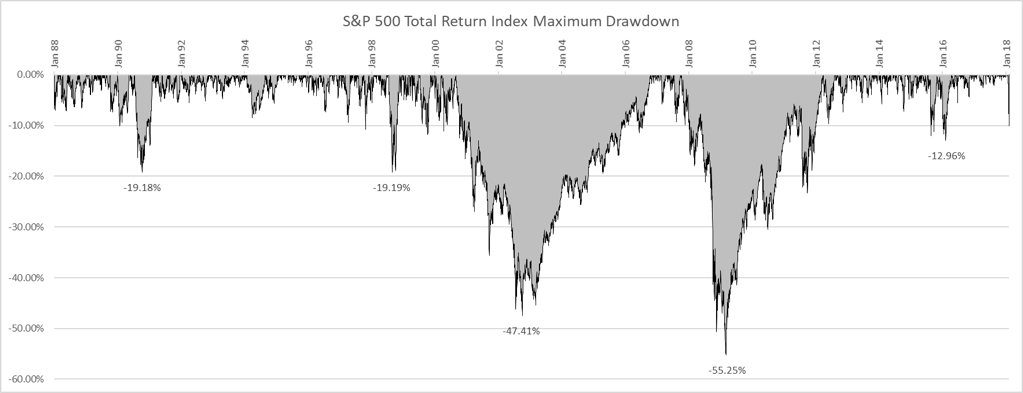
The current drawdown is -10.10% as of 2/8/18. It is important to note two metrics about this data:
-
- We have had several drawdowns that could be called market-corrections in the range of (-5.00% to -20%)
- The average recovery time to reach a level before a drawdown occurs is relatively short:
- The average recovery for a -10.00% to -11.00% drawdown is 53 days
- The longest time to recovery (except 2002 & 2009) is only 102 days

Bottomline
“This too will pass,” as the saying goes. All metrics point to this event as being a window of opportunity to buy, even if it takes a few days for the markets to fully recover.
This article was written by Joe Mallen and Chris Shuba of Helios Quantitative Research, a participant in the ETF Strategist Channel. Helios Quantitative Research provides financial advisors with the ability to offer state-of-the art, algorithm-driven asset management solutions to their clients on any platform.
