

The dollar has increased in value by 7.23% measured by the Invesco DB US Dollar Bullish ETF (UUP) attributing to much of the recent divergence. China has been hit hard, down -15.6% on the year (iShares MSCI China ETF MCHI) at the center of trade tariff disputes.
iShares MSCI Emerging Markets ETF (IEMG) was down -13.35% and lost -5.88% since the end of the third quarter. Trade tariffs with China have pushed Chinese markets down and have strengthened the dollar. China is also a source of global economic risk as debt levels in the region remain a concern. Despite this, we see much more upside in potential growth names in emerging markets when compared to the rest of the globe. If markets are to continue to fall, we don’t see downside in emerging markets being of much greater magnitude than domestic markets (from this point, as EM already has a head start down). Our focus in the emerging markets space has been what we call emerging market FAANG, allocated using the Emerging Markets Internet & Ecommerce ETF (EMQQ).
What it means when diversification temporarily fails?
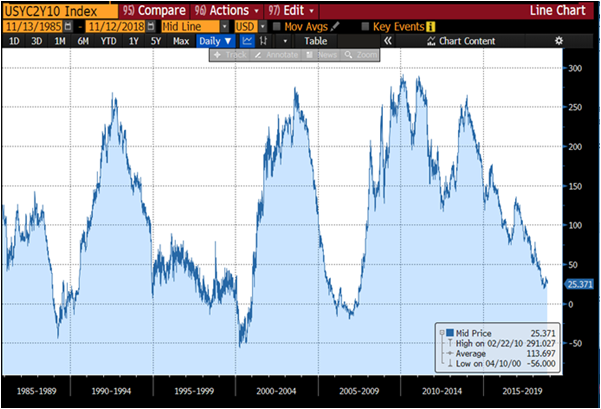
The iShares Core US Aggregate bond ETF (AGG) is down -1.99% for the year and down -0.35% since the end of the 3rd quarter. Longer term treasuries performed even worse, as the iShares 20+ Treasury Bond ETF (TLT) is down -7.64% on the year and -1.77% since the end of the 3rd quarter. We are close to experiencing a negative yield curve, which historically has been a precursor to recessions. What exactly is a negative yield curve? It’s when the difference in yield between a 10 year treasury bond and a 2 year treasury bond goes negative (shorter term debt yielding more than longer term debt). To see how close we are to this occurring a historical chart of the spread can be found below measured in basis points (100 is 1%).
Another signal from bond markets that trouble is ahead is typically seen in credit spreads. A credit spread compares the yield between a US Treasury bond with bonds that have the same maturity but of lesser credit quality. Spreads tend to widen preceding a recession by 3 to 12 months.
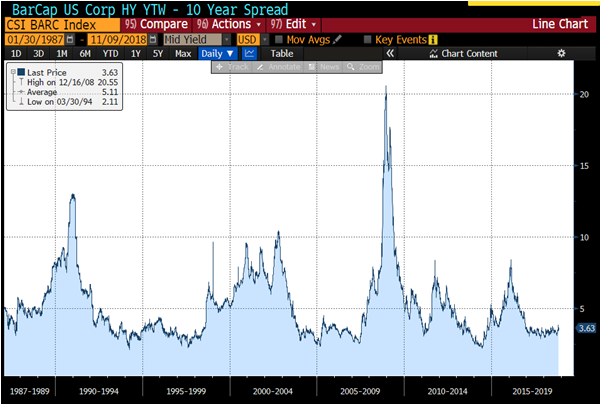
Spreads have not begun to widen in any significant manor, but it is something we are monitoring. We continue to move further away from market cap weighted index’s in the fixed income space in favor of active approaches. The top ten largest high yield issuers are owned across the board by almost all broad high yield funds.
Where to turn?
Estimates for returns on a 60/40 portfolio over the next 5-10 years are mid to low single digits, almost no matter who you ask. Now more than ever, we find it important to think outside of traditional indexing and sector investing, and focus on alternative index construction and thematic investments. We believe this to be true because certain themes are irreversible. We also mention that market cap weighted ETFs overweight based upon size not successful trends. Think about what the failure of General Electric (GE) has done to the overall market. Worse than just that, is the fact that fixed income ETFS are weighted by availability of credit and issuance size contradicts the whole thesis around credit. Would you want to build a credit portfolio according to those who had the most debt with the lowest credit scores?
This article was written by the team at Toroso Asset Management, a participant in the ETF Strategist Channel.
Click here to see disclosures.