What Occurred Since Your Last Quarterly Commentary?
The headline for our October commentary was “Why am I down when the markets up?” As of September 30th, the iShares Core S&P 500 ETF (IVV) was up 10.53%. Growth was outperforming Value by 13.65%, and small caps were up a staggering 23.96% on the year. Fast forward 50 days, IVV is still holding onto positive returns (4.07%) held up by growth and small caps stock’s strong 9 month start to the year, while almost everything else is down. To put into perspective the pain a diversified client experienced, a balanced portfolio, 60% in global equities, 40% in bonds, is down -2.27% year to date as of the end of October, trailing the S&P 500 by over 6%. This balanced portfolio lost 4% since quarter end, as US equities, international developed equities, emerging market equities, and bonds were all down. It’s important to note, the pain versus US equities was not because of it’s relative 4th quarter performance thus far, rather the 9 months leading up to it. That same 60/40 portfolio was only up a staggering 1.8% as of September 30th, as all 3 of international developed equities, emerging market equities, and bonds were down for the year before October even began. All while a savings account will net you 2%.
Fear not, diversification is not dead, just sometimes painful!
What lies ahead?
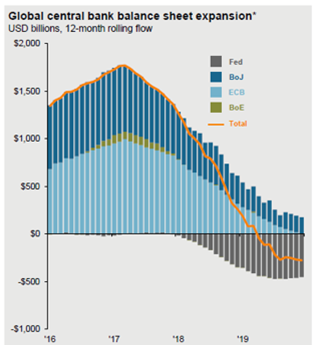
We often speak about the reversal (contraction) of quantitative easing by global central banks. The time has now come, and liquidity is draining as debt rolls over without redeployment across the globe. It’s effects on the markets are unknown. We were told not to fight the Fed during QE, and similar warnings may be forming as it unwinds.
In previous blasts, we’ve covered how much the market is paying for each dollar of revenue, near record highs, but unicorns can only fly so high. This most similarly resembled the Tech expansion of the late 90s, as the expansionary period at the turn of the century was not pushed by stretched fundamentals. We’ll instead point out the United States’ expansion in net profit margins.
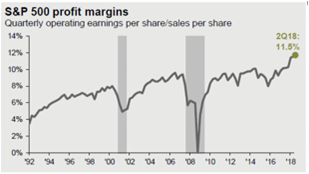
Most of the returns experienced in US markets this year prior to October were driven by earnings growth. Since the bear market of ‘08, profit margins in the US have grown from average levels of around 6% to an all-time high of 11.5%. That means when FAANG stocks produced amazing quarterly results for the better part of half a decade, it was not just an increase in sales, but rather a significant increase in profit on each unit of sale. Margins can only be stretched so far, unicorns can only fly so high, and unreasonable expectations can only be met so many times before future expectations dwarf anything possible.
From an economic perspective, an argument can be made that the US is still humming at full speed with low unemployment and wage growth. The market and the economy don’t always move in lockstep as you may know.
In US equities, we have begun to shift away from traditional market-cap weighted index’s after a seemingly 9 year run in momentum stocks in favor of more unique structures to try and capture value in the large cap space such as Reverse Cap Weighted US Large Cap ETF (RVRS).
Tax Cuts & Trade Tariffs
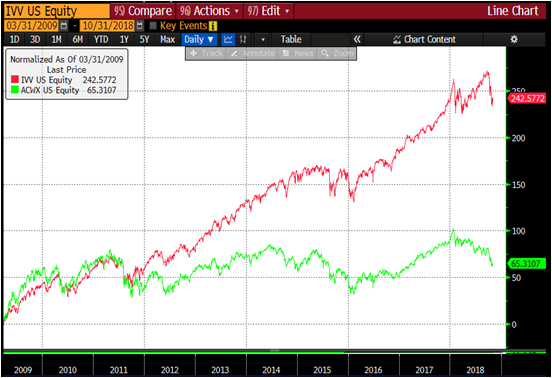
The economic benefits of the tax cuts and trade tariffs are what caused the continued divergence between US and International Equities this year, continuing the theme of the last 7 years. Many forget that emerging markets outperformed US equities substantially between 2016 and 2017, but the longer-term trend can be seen below.