
By Roman Chuyan, CFA, Model Capital Management
- Our equity model’s 6m forecast for the S&P 500 declines slightly on higher market valuation.
- According to the negative forecast, we continue with defensive portfolio positioning.
US stocks jumped last week on the news that the US-China phase-one trade deal is completed. The S&P 500 gained 1% so far in December. Another source of uncertainty, the UK general elections, was resolved with the Tories gaining a majority of 80 in the House of Commons, the largest majority since 1987. This made Brexit all but certain by January 31st. Non-US stocks outperformed, gaining 2.7% this month.
US and Global Markets, 10 Years

In this year-end report, I’d like to provide a broader perspective. This is the end not only of 2019 but of the 2010’s as we move into the next decade. What should we expect from markets in the 20’s? My thoughts are below.
It was the “roaring 10’s.” Financial markets enjoyed a decade of strong gains, led by US stocks. The S&P 500 delivered a remarkable cumulative total return of 342% over the decade, while non-US stocks gained only a third of that, 112% (see chart above). US aggregate bonds delivered a 47% total return.

Market gains were fueled largely by borrowing. Aggressive quantitative easing by central banks provided cash that found its way into assets including bonds, stocks, and real estate. While the Fed began to raise rates in 2016-18 (before its recent U-turn), central banks in Europe and Japan kept it going. Total US debt continued to grow, now at 73.4 trillion, or 345% of GDP. Some of the debt was raised by corporations for share buy-backs.
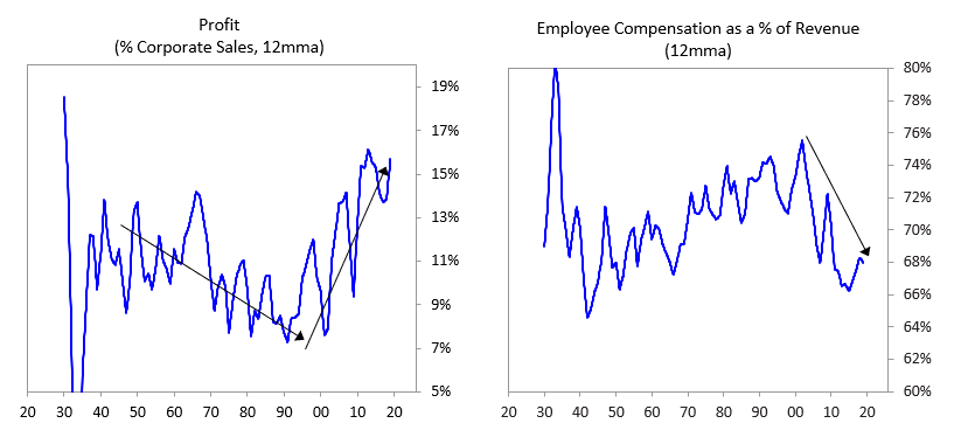
Globalization has been a major trend in developed industrialized democracies – the U.S., developed Europe, and Japan – in recent decades. This increased profits at the expense of labor costs. While globalization helped grow and concentrate wealth, it hasn’t worked so well for the working and middle classes whose living standards stagnated. In response to this, populist movements have gained strength in recent years.
We are witnessing a paradigm shift. Populist and anti-globalist leaders were elected in the U.S., Japan, the U.K., and several other major countries, and are gaining ground in others. After Brexit was delayed for over three years In the U.K., this month’s landslide win by the Conservatives is another example of the trend.
Source: Ray Dalio, Paradigm Shifts, 7/17/2019
Understanding this paradigm shift helps us to envision what the 2020’s might look like. As many institutions do, we expect generally lower average returns with higher volatility than in the past decade. We also see several developing trends that might, in some periods, trigger significant market downside:
- The stimulating effect of quantitative easing has diminished. Manufacturing has stagnated globally, especially in Europe (see Economic Focus section below). Europe’s largest economies are teetering on the brink of a recession and there are now calls for new easing – but rates are already negative in much of Europe. Although they don’t admit it, central banks are out of tools. If Europe slides into an economic contraction, it will likely be not just a “recession” but a “crisis.” It will also prove that quantitative easing – the foundation for the “roaring 10’s” – is no longer working.
- Debt has grown globally to new records as a share of GDP. In the US, government, corporate, and most personal debt are above their 2007 peaks. China is slowing, and has a serious debt problem of its own. Interest payments are manageable, but any rise in rates will put pressure on borrowers. As economies are slowing, a debt problem in one economy or sector might seize up the broad market.
- Populism boosts the working class, but what’s good for workers is bad for profits. US wages are already growing at above 3%, the quickest since 2009. The share of wages will likely increase at the expense of profits, and over-15% profit margins shown on the chart above will likely prove to be a long-term peak. With declining profits, stocks will become even more overvalued.
- As economic nationalism gains momentum, wealth redistribution from developed to emerging economies will diminish. Countries like China that previously benefited will have to learn to carry their own weight. Another example is that Middle Eastern and Russian oil revenues are diminishing due to increased American energy production and exports. Bilateral agreements will replace global arrangements, and there will be winners and losers. As some countries lose, they will become more aggressive.
Economic Focus
Weakening global manufacturing
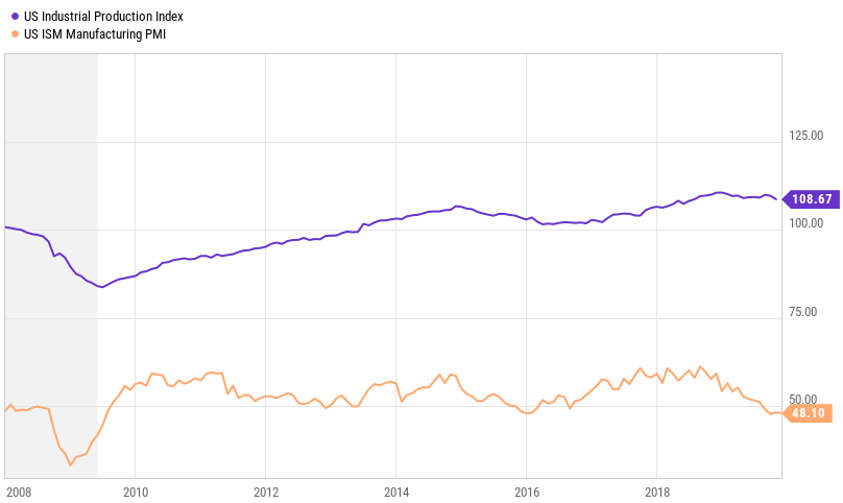
U.S. GDP continued to grow at a decent rate of 2.1% in the third quarter of 2019, fueled by consumer spending. However, manufacturing continued to weaken in recent months. The purchasing manager’s index fell to 48 in the past three months – its lowest level since Jan-2016, and 2009 before that. The Fed’s Industrial Production Index has turned down as well, confirming this weakening trend in manufacturing.
US Manufacturing, 2008-2019
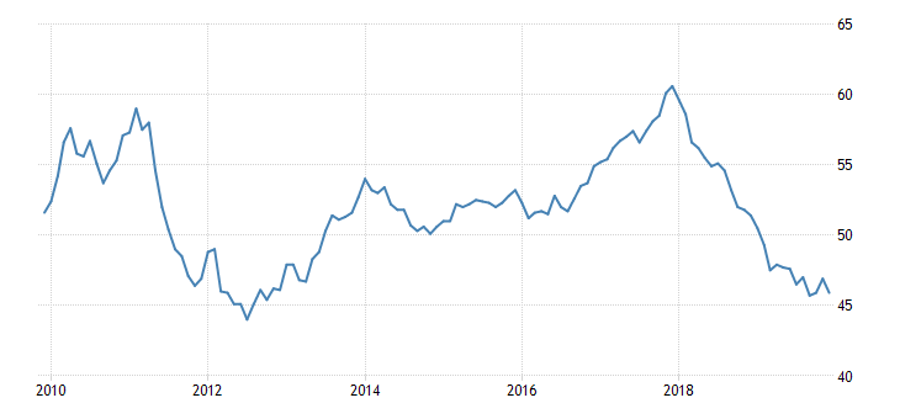
Things look much bleaker in Europe. The Eurozone’s GDP slowed to 1.2% annualized in Q3, and Europe’s largest economies – the U.K. and Germany – teeter on the brink of contraction. The Eurozone Manufacturing PMI plunged to 46, a level not seen since the European financial crisis of 2011-12:
Eurozone Manufacturing PMI, 10 Years
About Model Capital Management LLC
Model Capital Management LLC (“MCM”) is an independent SEC-registered investment advisor, and is based in Wellesley, Massachusetts. Utilizing its fundamental, forward-looking approach to asset allocation, MCM provides asset management services that help other advisors implement its dynamic investment strategies designed to reduce significant downside risk. MCM is available to advisors on AssetMark, Envestnet, and other SMA/UMA platforms, but is not affiliated with those firms.
Notices and Disclosures
- This research document and all of the information contained in it (“MCM Research”) is the property of MCM. The Information set out in this communication is subject to copyright and may not be reproduced or disseminated, in whole or in part, without the express written permission of MCM. The trademarks and service marks contained in this document are the property of their respective owners. Third-party data providers make no warranties or representations relating to the accuracy, completeness, or timeliness of the data they provide and shall not have liability for any damages relating to such data.
- MCM does not provide individually tailored investment advice. MCM Research has been prepared without regard to the circumstances and objectives of those who receive it. MCM recommends that investors independently evaluate particular investments and strategies, and encourages investors to seek the advice of an investment adviser. The appropriateness of an investment or strategy will depend on an investor’s circumstances and objectives. The securities, instruments, or strategies discussed in MCM Research may not be suitable for all investors, and certain investors may not be eligible to purchase or participate in some or all of them. The value of and income from your investments may vary because of changes in securities/instruments prices, market indexes, or other factors. Past performance is not a guarantee of future performance, and not necessarily a guide to future performance. Estimates of future performance are based on assumptions that may not be realized.
- MCM Research is not an offer to buy or sell or the solicitation of an offer to buy or sell any security/instrument or to participate in any particular trading strategy. MCM does not analyze, follow, research or recommend individual companies or their securities. Employees of MCM may have investments in securities/instruments or derivatives of securities/instruments based on broad market indices included in MCM Research.
- MCM is not acting as a municipal advisor and the opinions or views contained in MCM Research are not intended to be, and do not constitute, advice within the meaning of Section 975 of the Dodd-Frank Wall Street Reform and Consumer Protection Act.
- MCM Research is based on public information. MCM makes every effort to use reliable, comprehensive information, but we make no representation that it is accurate or complete. We have no obligation to tell you when opinions or information in MCM Research change.
- MCM DOES NOT MAKE ANY EXPRESS OR IMPLIED WARRANTIES OR REPRESENTATIONS WITH RESPECT TO THIS MCM RESEARCH (OR THE RESULTS TO BE OBTAINED BY THE USE THEREOF), AND TO THE MAXIMUM EXTENT PERMITTED BY LAW, MCM HEREBY EXPRESSLY DISCLAIMS ALL WARRANTIES (INCLUDING, WITHOUT LIMITATION, ANY IMPLIED WARRANTIES OF ORIGINALITY, ACCURACY, TIMELINESS, NON-INFRINGEMENT, COMPLETENESS, MERCHANTABILITY AND/OR FITNESS FOR A PARTICULAR PURPOSE).
- “Model Return Forecast” for 6-month S&P 500 return is MCM’s measure of attractiveness of the U.S. equity market obtained by applying MCM’s proprietary statistical algorithm and historical data, but is not promissory, and, by itself, does not constitute an investment recommendation. Model Return Forecasts were calculated and applied by MCM to its research and investment process in real time beginning from 2012. For periods prior to Jan 2012, the results are “back-tested,” i.e., obtained by retroactively applying MCM’s algorithm and historical data available in Jan 2012 or thereafter. Source for the S&P 500 actual returns: S&P Dow Jones.
- Index returns referenced in MCM Research, if any, are gross of any advisory fees, fund management fees, and trading expenses. Fund or ETF returns referenced, if any, are gross of advisory fees and trading expenses. Returns will be reduced by fees and expenses incurred.
