
By Roman Chuyan, CFA, Model Capital Management
- Our fundamentals-based process has helped protect against the entire downturn so far.
- Stocks are cheaper, but economic factors are now negative, and so is our outlook for the S&P 500.
- I describe developing themes (earnings, economic) that might continue to pressure markets.
All major stock indexes resumed their plunge and entered bear markets, defined as an over-20% decline from peak, thus terminating the preceding 11-year bull market. This is an interesting time, and I have a lot to write about. I’ll first cover market trends (some very unusual), and then discuss emerging fundamental themes including economic and earnings.
But first, let me note that we continue to protect our clients against this downturn. The YTD returns in our Tactical Growth and Income strategies are low-positive from interest on short-term T-Bills. Our models gave signals to de-risk well ahead of the market plunge. In retrospect, our models did exactly what they were designed to do – an example of how our forward-looking process protects against a violent selloff such as this, while backward-looking models cannot.
Market Trends
Years of bull market and an accommodative Fed encouraged overinvestment in risk assets – including stocks, but also high-yield and investment-grade bonds. Some took more risk than was appropriate for them, hoping to sell in time. But the warning memo never arrived. Now, many investors heading for the exit at the same time makes this selloff especially steep.
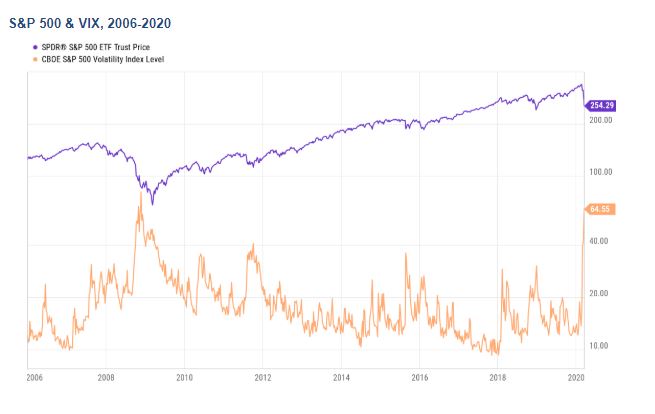
In stocks, “fear indicators” spiked to the levels of previous severe selloffs. The Put/Call ratio jumped to 1.83 on March 9 – nearly the same as its peak of 1.82 in December-2018. Implied volatility – the VIX – jumped to 75 on March 12, previously exceeded only in October-November of 2008. This is real fear.
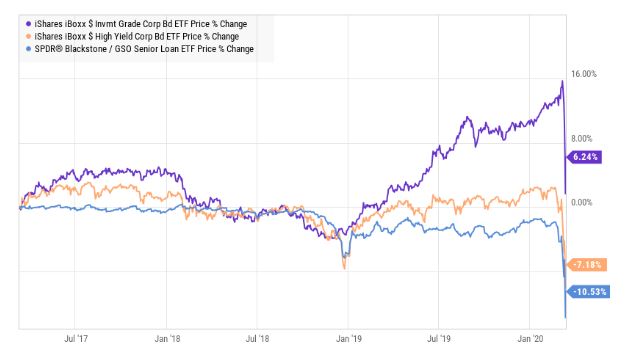
Corporate and high-yield bonds and loans also dropped sharply, now down 8-9% from their recent peaks (see chart). Expecting bonds to gain when stocks fell, some managers have expressed surprise. They wouldn’t if they’d studied bear markets. While negative correlations hold in a “normal” environment, credit always sells off in severe downturns such as in 2008. That’s why we’ve been holding US Treasuries.
Bond Price Returns, 3 Years
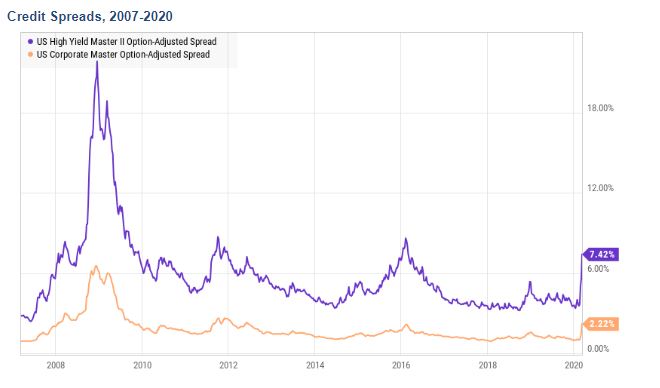
The corresponding credit spreads widened significantly, close to their previous “moderate” peaks in 2011 and 2016 – but not yet nearly to their 2008-09 levels:
Finally, currencies moved in unusual ways. Emerging-market currencies had been falling for some time, and have now plunged to, or near, their all-time lows. During the rout, the Euro and the Yen rallied (the dollar fell). This was driven by an unwinding of hedge funds’ “carry” strategies rather than by confidence in those economies. It appears that the unwinding has mostly run its course.
Fundamental Themes
As I’ve written previously, the problem is not just the coronavirus pandemic, but that it’s happening amid a fragile macro environment. Valuation and leverage were extreme amid slowing global growth and flat earnings. The coronavirus containment efforts escalated quickly, and now affect everyday lives. Travel declined, schools and universities closed or moved online, events were cancelled, and companies sent people to work from home. Apple just announced closing all its retail stores outside China until March 27. All this puts pressure on economic activity – but we don’t yet know how much. Economic data is available only with a lag. Among early indicators, consumer sentiment has begun to ease only modestly. Our equity model detects weakness in the Houses for Sale data – a similar pattern to that in 2007. JP Morgan now projects a US recession, expecting GDP to fall 2% in Q1 and 3% in Q2.
Economic projections follow markets. JP Morgan’s recession warning could be correct, but it didn’t precede this market plunge – it followed it. To inform our investment thesis, we think about upcoming themes:
Earnings
Companies give guidance in analyst calls at the end of each quarter. Negative guidance was one reason for the market drop in Dec-2018, in my view – earnings began small declines in early 2019 from 13% growth in Q4-2018. Earnings for the current, first quarter of 2020 will likely be terrible. Not only travel and hospitality were hit by the epidemic; energy and materials were hit by plunging commodity prices, but broad weakness is likely across other sectors. This might initiate another wave of selling in late March.
Economic projections
Other major banks will likely follow JP Morgan in uttering the “R” word, which will create more negative sentiment and selling. Investors remember that bear markets set on in recessions.
Institutions
Hedge funds can move quickly, and were likely among the first to de-risk. Currency moves suggest that the carry trade is now reversed, and so are probably most net-long hedge fund strategies. However, other institutional selling has only begun. Trend-following, volatility-driven, and risk-parity strategies have de-risked by around half. Long-term money – pensions, endowments and foundations – tends to shift based on prevailing economic and earnings projections (which are now falling) and to act quarterly (end of Q1 is approaching). This wave of selling will be larger the worse economic and earnings projections look.
Coronavirus
The epidemic has continued to drive market moves ever since it first pricked the bubble. Global infections are now growing at about 10,000 per day. Aside from increased test availability, the quickening or slowing of its spread and any news of development of a vaccine or cure will continue to affect markets.
Finally, I’d like to shift focus to the long term. In my mid-December article titled Welcome to the 2020’s, I described an environment with lower average returns and higher volatility, and with occasional sharp downturns – and the one now unfolding confirms this thesis. Buy-and-hold strategies worked well during the 2010’s bull market, so it’s understandable that investors didn’t bother with downside protection. We think that downside protection will be critical in the new environment. Looking back at the past month is not really a good reason to begin using us – looking ahead to the next 10 years is.
Strategy Descriptions
Core Dynamic Balanced
This is a diversified core allocation strategy designed to take advantage of the expected U.S. economic growth in the coming years. The strategy includes above-benchmark exposure to equity sectors that are expected to benefit from this trend, while managing the risk of rising interest rates.
The primary objective of the Balanced Allocation is total return from participation in equity and fixed-income markets, while heavily emphasizing managing downside risk; with secondary objective of interest income. The portfolio can include ETF or index fund investments in Treasury inflation-protected securities (TIPS), corporate bonds, senior loans (up to 20%), other fixed-income asset classes, and U.S. large-cap and mid-cap equities. The benchmark is 60% S&P 500, 40% Barclays US Aggregate bond index. Equity allocation Min/Max: 35%/50% Fixed income allocation Min/Max: 50%/65%
Core Dynamic Growth-Plus
This is a diversified core allocation strategy designed to take advantage of the expected U.S. economic growth in the coming years. The strategy includes above-benchmark exposure to equity sectors that are expected to benefit from this trend, while managing the risk of rising interest rates.
The primary objective of the Growth-Plus Allocation is total return from participation in equity markets, while heavily emphasizing managing downside risk; with secondary objective of total return from fixed-income markets. The portfolio can include ETF or index fund investments in U.S. large-cap and mid-cap equities, Treasury inflation-protected securities (TIPS), corporate bonds, senior loans (up to 17%), and other fixed-income asset classes. The benchmark is 60% S&P 500, 40% Barclays US Aggregate bond index. Equity allocation Min/Max: 46%/70% Fixed income allocation Min/Max: 30%/54%.
Tactical Growth Limit-Loss
The stock market is the best way to build wealth – but it could also put portfolios and financial goals at risk. In order to reduce the risk of significant downside, we apply a fundamental, forward-looking approach to tactical asset management.
The objective of the Tactical Growth Limit-Loss strategy is to provide U.S. market exposure and participation in rising markets while heavily emphasizing risk management in down markets. The portfolio can include ETF or index fund investments in one or multiple asset classes including U.S. large-cap equity, fixed income, and/or cash equivalents. The strategy allocates up to 100% of assets to equities (risk-on allocation) or to fixed-income or cash equivalents (risk-off), primarily based on the manager’s proprietary model’s 6-month return forecast for the S&P 500 index, also taking into account short-term risk and other fundamentals. The benchmark is the Morningstar Tactical Allocation index.
Tactical 2xGrowth Limit-Loss
The stock market is the best way to build wealth – but it could also put portfolios and financial goals at risk. In order to reduce the risk of significant downside, we apply a fundamental, forward-looking approach to tactical asset management.
The objective of the Tactical 2xGrowth Limit-Loss strategy is to provide U.S. market exposure and participation in rising markets, while heavily emphasizing risk management in down markets. The portfolio can include ETF or index fund investments in one or multiple asset classes including U.S. large-cap equity, fixed income, commodities (up to 40%), and/or cash equivalents. The strategy allocates to equities (risk-on allocation) or to fixed-income or cash equivalents (risk-off), primarily based on the manager’s proprietary model’s 6-month return forecast for the S&P 500 index, also taking into account short-term risk and other fundamentals. The strategy may, at times, utilize up to 2x leverage (200% allocation) to equities, when the forecast for the S&P 500 is especially strong. The benchmark is the S&P 500 index.
Tactical Income
The objective of the strategy is to generate income from exposures to U.S. fixed income markets, and total return from participation in various fixed income markets while heavily emphasizing managing downside risk. The portfolio can include ETF or index fund investments in Treasuries, corporate bonds, cash equivalents, and high-yield bonds and loans. A set of proprietary models is utilized by the Manager to evaluate attractiveness of risk-return for each asset class. Each model uses several indicators that historically proved to identify or lead changes in asset class risk-return trends. The benchmark is Barclays US Aggregate bond index.
About Model Capital Management LLC
Model Capital Management LLC (“MCM”) is an independent SEC-registered investment advisor, and is based in Wellesley, Massachusetts. Utilizing its fundamental, forward-looking approach to asset allocation, MCM provides asset management services that help other advisors implement its dynamic investment strategies designed to reduce significant downside risk. MCM is available to advisors on AssetMark, Envestnet, and other SMA/UMA platforms, but is not affiliated with those firms.
Notices and Disclosures
- This research document and all of the information contained in it (“MCM Research”) is the property of MCM. The Information set out in this communication is subject to copyright and may not be reproduced or disseminated, in whole or in part, without the express written permission of MCM. The trademarks and service marks contained in this document are the property of their respective owners. Third-party data providers make no warranties or representations relating to the accuracy, completeness, or timeliness of the data they provide and shall not have liability for any damages relating to such data.
- MCM does not provide individually tailored investment advice. MCM Research has been prepared without regard to the circumstances and objectives of those who receive it. MCM recommends that investors independently evaluate particular investments and strategies, and encourages investors to seek the advice of an investment adviser. The appropriateness of an investment or strategy will depend on an investor’s circumstances and objectives. The securities, instruments, or strategies discussed in MCM Research may not be suitable for all investors, and certain investors may not be eligible to purchase or participate in some or all of them. The value of and income from your investments may vary because of changes in securities/instruments prices, market indexes, or other factors. Past performance is not a guarantee of future performance, and not necessarily a guide to future performance. Estimates of future performance are based on assumptions that may not be realized.
- MCM Research is not an offer to buy or sell or the solicitation of an offer to buy or sell any security/instrument or to participate in any particular trading strategy. MCM does not analyze, follow, research or recommend individual companies or their securities. Employees of MCM may have investments in securities/instruments or derivatives of securities/instruments based on broad market indices included in MCM Research.
- MCM is not acting as a municipal advisor and the opinions or views contained in MCM Research are not intended to be, and do not constitute, advice within the meaning of Section 975 of the Dodd-Frank Wall Street Reform and Consumer Protection Act.
- MCM Research is based on public information. MCM makes every effort to use reliable, comprehensive information, but we make no representation that it is accurate or complete. We have no obligation to tell you when opinions or information in MCM Research change.
- MCM DOES NOT MAKE ANY EXPRESS OR IMPLIED WARRANTIES OR REPRESENTATIONS WITH RESPECT TO THIS MCM RESEARCH (OR THE RESULTS TO BE OBTAINED BY THE USE THEREOF), AND TO THE MAXIMUM EXTENT PERMITTED BY LAW, MCM HEREBY EXPRESSLY DISCLAIMS ALL WARRANTIES (INCLUDING, WITHOUT LIMITATION, ANY IMPLIED WARRANTIES OF ORIGINALITY, ACCURACY, TIMELINESS, NON-INFRINGEMENT, COMPLETENESS, MERCHANTABILITY AND/OR FITNESS FOR A PARTICULAR PURPOSE).
- “Model Return Forecast” for 6-month S&P 500 return is MCM’s measure of attractiveness of the U.S. equity market obtained by applying MCM’s proprietary statistical algorithm and historical data, but is not promissory, and, by itself, does not constitute an investment recommendation. Model Return Forecasts were calculated and applied by MCM to its research and investment process in real time beginning from 2012. For periods prior to Jan 2012, the results are “back-tested,” i.e., obtained by retroactively applying MCM’s algorithm and historical data available in Jan 2012 or thereafter. Source for the S&P 500 actual returns: S&P Dow Jones.
- Index returns referenced in MCM Research, if any, are gross of any advisory fees, fund management fees, and trading expenses. Fund or ETF returns referenced, if any, are gross of advisory fees and trading expenses. Returns will be reduced by fees and expenses incurred.
