By Gary Stringer, Kim Escue and Chad Keller, Stringer Asset Management
When equity market volatility is the byproduct of significantly deteriorating economic conditions, such as late 2015 and early 2016, we think that portfolio risk should be reduced within the context of an investor’s financial plan. In that 2015 to 2016 environment, we saw signs of economic stress at the same time as the U.S. Federal Reserve (Fed) was raising interest rates for the first time since the global financial crisis. These factors caused us to become more defensive and reduce equity market exposure.
While market volatility has increased recently, economic conditions are not getting significantly worse. We think that investors should either look past the current market volatility or take advantage of the declines to buy during market dips as forward-looking indicators suggest continued economic growth and higher stock prices in the coming months.
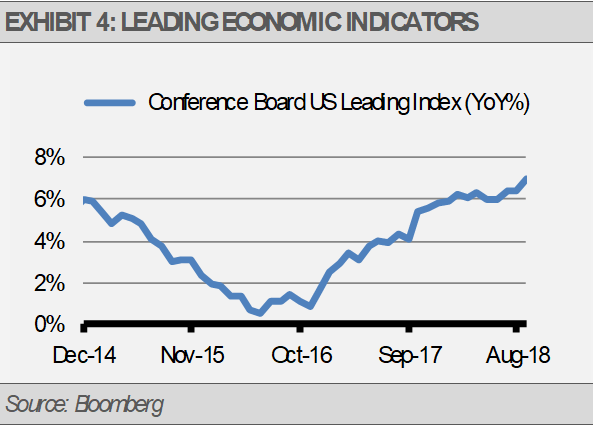
For instance, though the yield curve has flattened recently, we do not see this as a risk yet. An inverted yield curve (when 10-year Treasury yields fall below 1-year Treasury yields), has accurately predicted every recession for more than 50 years with a one or two-year lead time. Importantly, a flattening yield curve does not signal a recession.
In effect, the yield curve is a long lead time binary signal. With a positive slope, the yield curve is signally that the recession is at least a year away. Historically, equity prices tend to peak roughly six months before a recession.
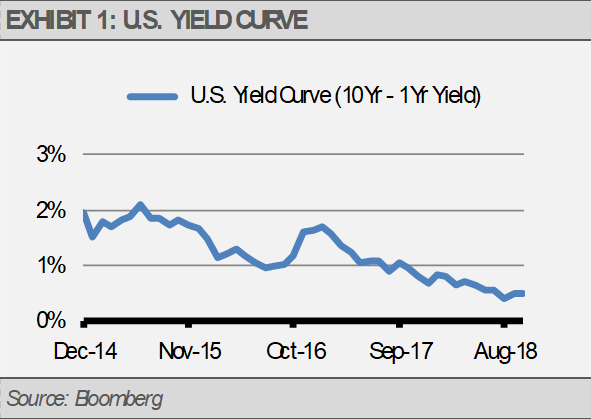
With the yield curve suggesting little risk of recession, we can look to other signals for confirming or contradicting data. For example, the Institute for Supply Management (ISM) Manufacturing Purchasing Managers Index (PMI) and Non-Manufacturing PMI can be helpful in gauging the rate of change in economic growth. Signals above 50 reflect economic expansion, while signals below 50 suggest contraction. As exhibit 2 illustrates, PMIs were declining going into 2016 and were on the verge of signaling contraction. This weakness gave us pause considering the Fed’s policy stance. However, current PMIs are signaling continued economic growth.
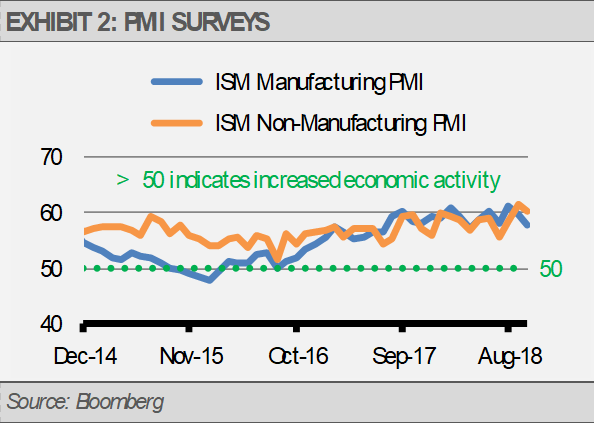
In addition to fundamental factors like PMI, we can look to bond market indicators, such as credit spreads, which measure the difference in yield between corporate bonds and U.S. Treasuries. Credit spreads reflect the bond market’s confidence in the economy and tend to increase prior to significant equity market declines. As exhibit 3 illustrates, credit spreads were much greater in the 2015 to 2016 environment than we see today. This suggests that the bond market has confidence in the continuation of the current business cycle, especially as compared to 2015-2016.
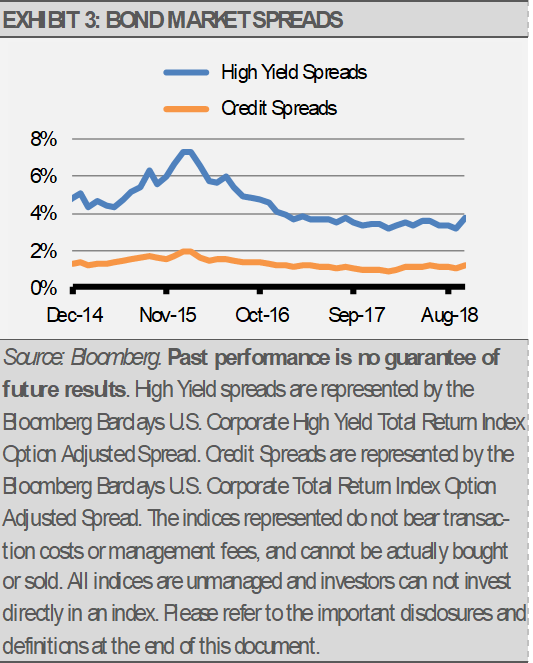
Finally, the Conference Board’s Leading Economic Index (LEI) is an aggregate of ten forward-looking indicators and can be useful in developing economic and market expectations. Consistent with the signals mentioned above, the composite LEI suggested deteriorating economic conditions in the 2015-2016 period while reflecting solid economic footing today (exhibit 4).