

With our collection of indicators generally looking positive, we expect the current business cycle to last at least another year and probably longer. Volatility can be healthy in this type of market environment. Given our sanguine outlook, we think that volatility gives investors the opportunity to invest in high quality assets at a discount to where they were priced just weeks ago.
In summary, while we expect the pace of economic growth to slow, there are few signs of recession risk over the near-term. Even slow economic growth allows for higher corporate revenues and earnings which can support higher stock prices. Furthermore, equity markets tend to peak roughly six months prior to the end of the business cycle. As a result, we expect global equities to make new highs in the coming months.
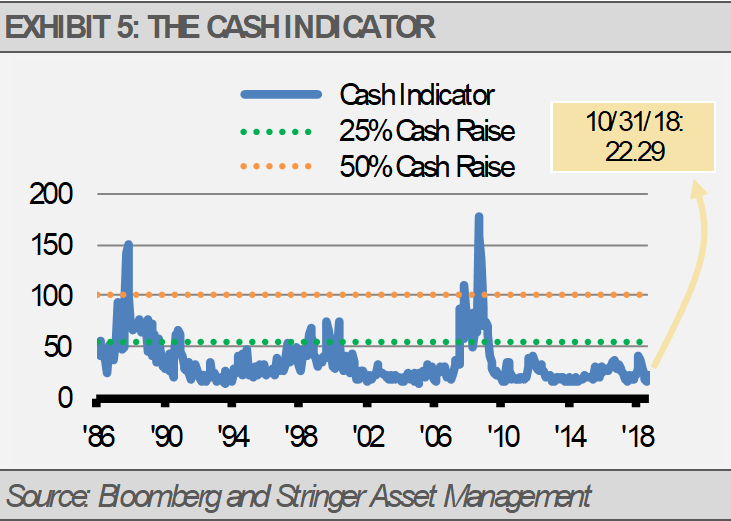
THE CASH INDICATOR
The Cash Indicator (CI) has bounced off very low levels recently but is still below its historical average and well below any level that would make us concerned. Consistent with our fundamental analysis, the CI suggests that there is plenty of liquidity in the global markets and volatility is tame.
This article was written by Gary Stringer, CIO, Kim Escue, Senior Portfolio Manager, and Chad Keller, COO and CCO at Stringer Asset Management, a participant in the ETF Strategist Channel.
DISCLOSURES
Any forecasts, figures, opinions or investment techniques and strategies explained are Stringer Asset Management, LLC’s as of the date of publication. They are considered to be accurate at the time of writing, but no warranty of accuracy is given and no liability in respect to error or omission is accepted. They are subject to change without reference or notification. The views contained herein are not be taken as an advice or a recommendation to buy or sell any investment and the material should not be relied upon as containing sufficient information to support an investment decision. It should be noted that the value of investments and the income from them may fluctuate in accordance with market conditions and taxation agreements and investors may not get back the full amount invested.
Past performance and yield may not be a reliable guide to future performance. Current performance may be higher or lower than the performance quoted.
The securities identified and described may not represent all of the securities purchased, sold or recommended for client accounts. The reader should not assume that an investment in the securities identified was or will be profitable.
Data is provided by various sources and prepared by Stringer Asset Management, LLC and has not been verified or audited by an independent accountant.
Index Definitions:
Bloomberg Barclays U.S. Corporate High Yield Index – This Index measures the USD-denominated, high yield, fixed-rate corporate bond market. Securities are classified as high yield if the middle rating of Moody’s, Fitch and S&P is Ba1/BB+/BB+ or below. Bonds from issuers with an emerging markets country of risk, based on Barclays EM country definition, are excluded.
Bloomberg Barclays U.S. Corporate Index – This Index measures the investment grade, fixed-rate, taxable corporate bond market. It includes USD denominated securities publicly issued by US and non-US industrial, utility and financial issuers.