
Catastrophic Stop Update
The NDR Catastrophic Stop Sell model combines time-tested, objective indicators designed to identify high-risk periods for the equity market. The model (Figure 1) was unchanged from last month and entered August with a fully invested equity allocation recommendation.
Figure 1: Smart Sector® Catastrophic Stop Sell Model
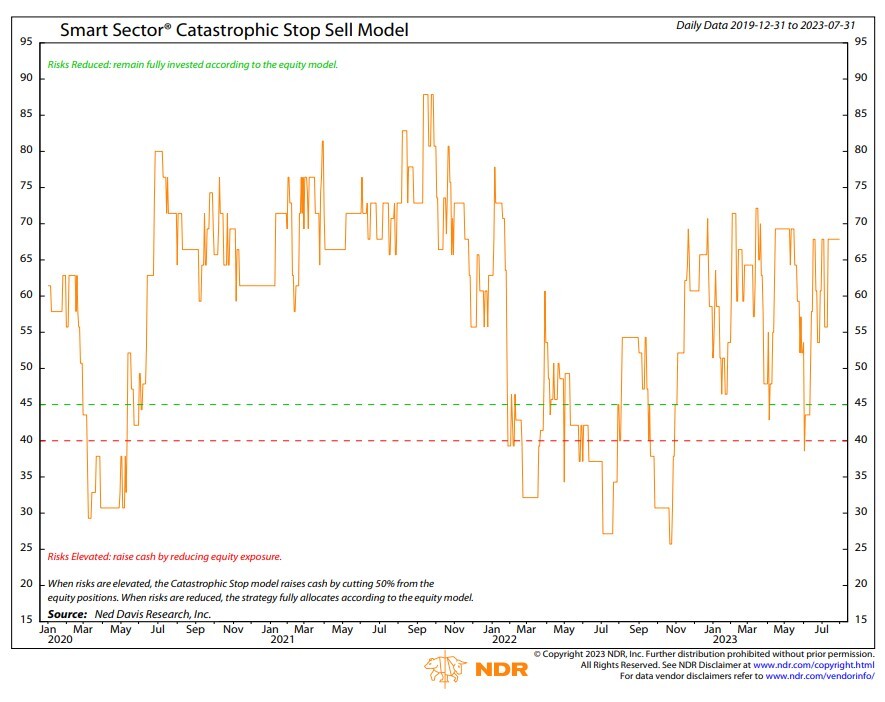
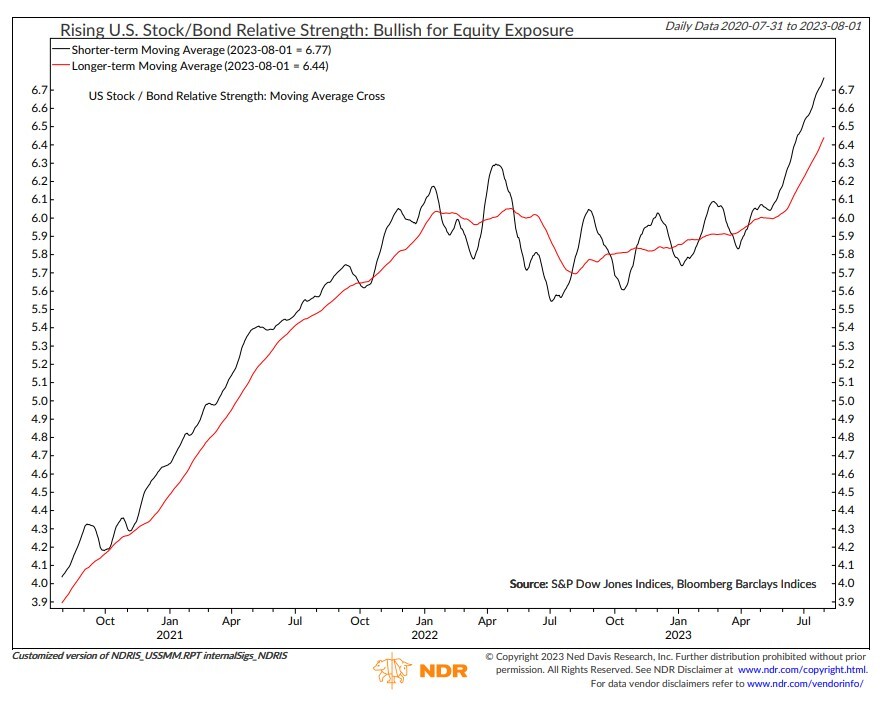
The model’s steadiness is driven by five (of seven) internal (price-based) measures that remain bullish, including rising stock/bond relative strength (Figure 2). While external influences such as trade and market sentiment remained bearish, they’re offset by bullish readings from high-yield and emerging market bond breadth, as well as high-yield option-adjusted spreads. For now, the weight of the evidence recommends a fully invested allocation to equity sectors according to the model.
Figure 2: Rising U.S. Stock/Bond Relative Strength: Bullish for Equity Exposure
U.S. Market Update
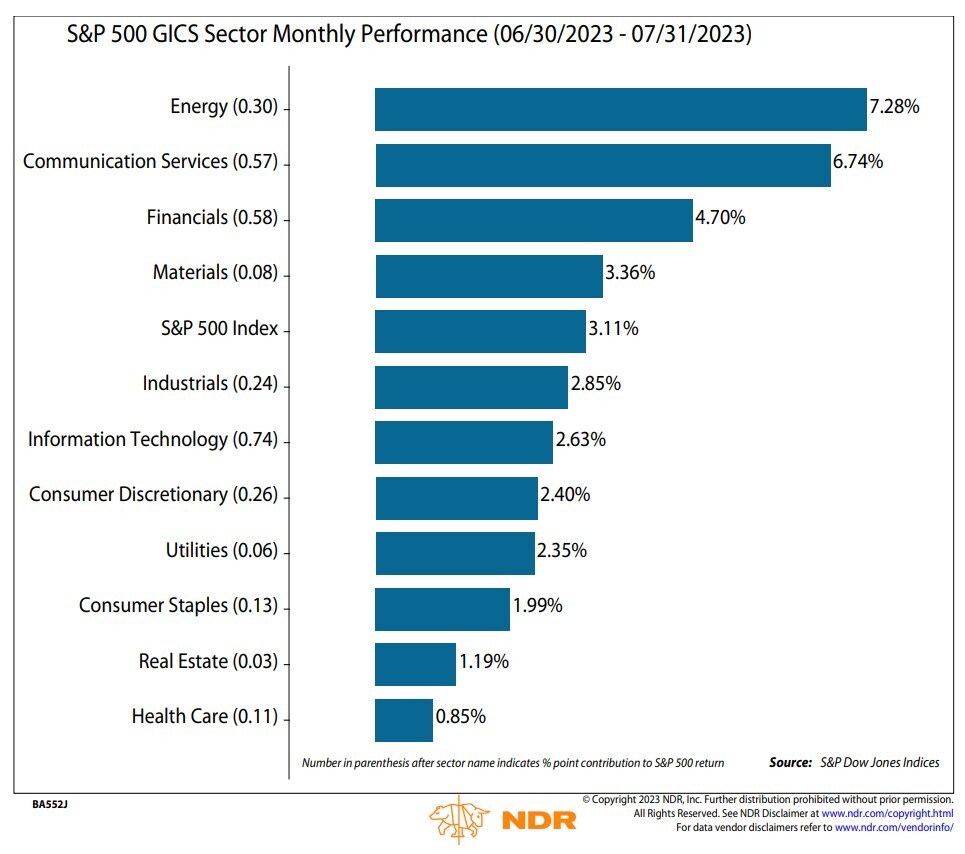
The S&P 500 gained 3% in July, up for the fifth month in a row. Breadth remained solid—all 11 S&P 500 sectors posted positive returns in July. Performance was led by cyclical Value sectors—Energy, Financials, and Materials—as well as Communication Services (Figure 3).
Factors that could contribute to a defensive rotation in the second half of the year include an aggressive Fed, a worsening economic outlook, and a moderation of stock market momentum. The biggest challenge for defensive leadership could be continued economic strength. Within cyclicals, Value sectors like Energy, Financials, and Materials have tended to be the most economically sensitive. However, multiple measures of extreme optimism represent a near-term risk for stocks and cyclical leadership.
The sector model remained with a mix of cyclical and defensive leadership during the month. Entering August, the sector model is overweight Energy, Health Care, Materials, and Utilities. Information Technology dropped to marketweight. Financials, Consumer Staples, and Real Estate are underweight.
Figure 3: S&P 500 GICS Sector Monthly Performance (06/30/2023-07/31/2023)
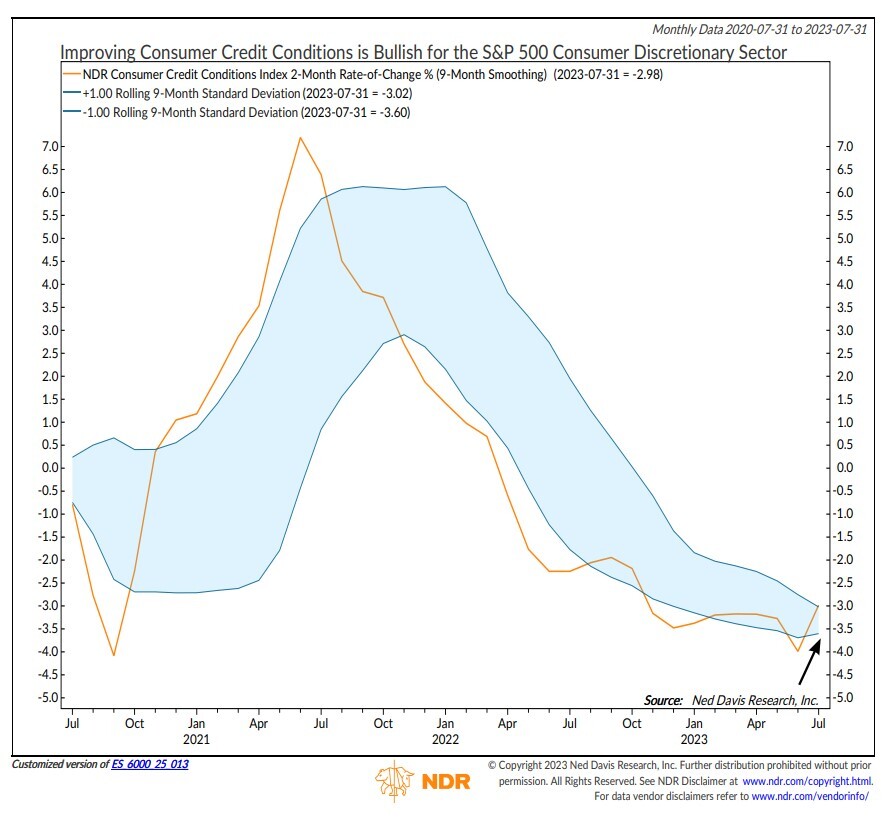
The Consumer Discretionary sector’s allocation remains neutral. On a fundamental basis, while housing starts and discretionary spending remain headwinds for the sector, other indicators improved. Both consumer credit conditions (Figure 4) and earnings surprises moved to bullish levels during the month. This was confirmed by five of six technical indicators being bullish.
Figure 4: Improving Consumer Credit Conditions is Bullish for the S&P 500 Consumer Discretionary Sector
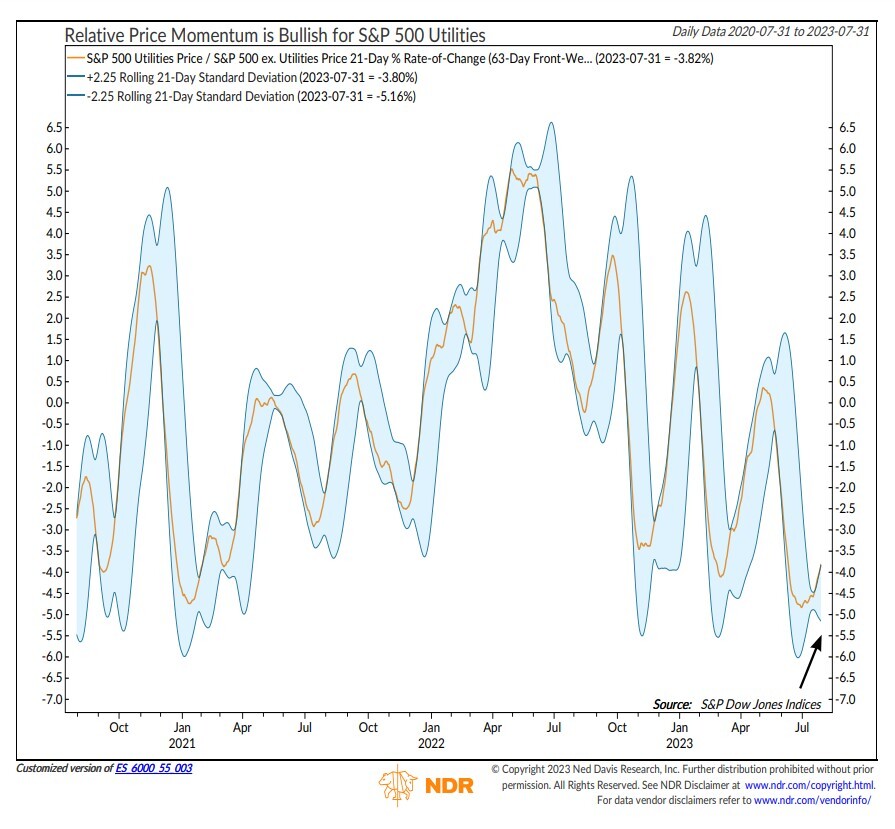
Allocation to the Utilities sector rose modestly in July and remained at overweight. While an improving copper/gold ratio (a measure of improving economic growth) moved bearish for this defensive sector during the month, there were several technical indicators that improved. Confirming the sector’s short-term oversold condition, an improvement in relative price momentum (Figure 5), price reversal, and breadth flashed bullish signals.
Figure 5: Relative Price Momentum is Bullish for S&P 500 Utilities
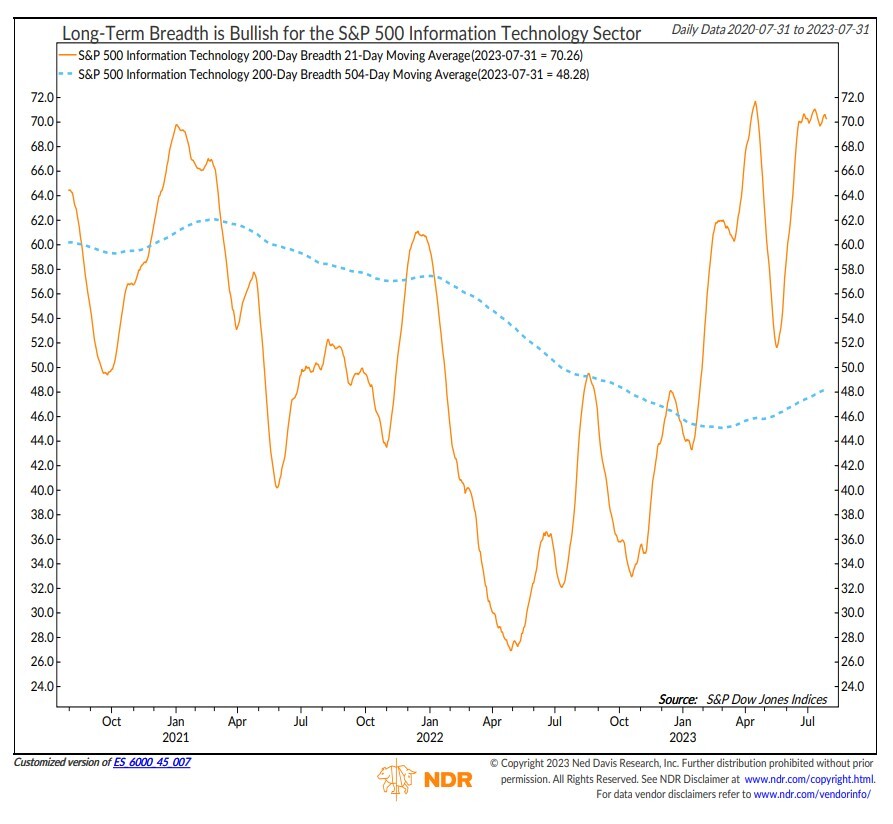
Allocation to the Information Technology sector dropped over 100 basis points in July, moving the sector to marketweight. Tech gains have moderated over the past two months and have been more in line with benchmark returns. There were no indicator changes during the month. Three of the five external (macro-based) indicators—sales yield, inflation expectations, and earnings revision breadth— continue to be bearish. Four of the five internal (price-based) indicators, including long-term sector breadth (Figure 6) remain bullish.
Figure 6: Long-Term Breadth is Bullish for the S&P 500 Information Technology Sector
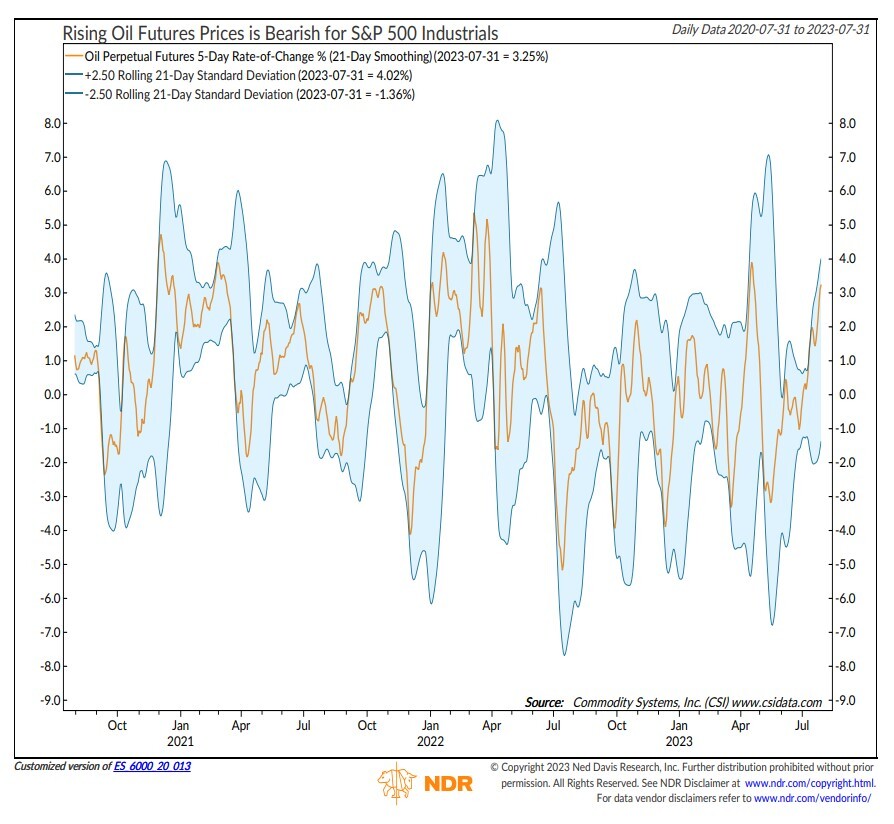
Industrials’ allocation declined 100 basis points, moving it to a slight underweight. Four of the seven external indicators are now bearish, with rising oil futures prices moving to a negative level for the sector during the month (Figure 7). However, four of the six internal (price-based) indicators remain bullish. Only 3-month volatility and a relative strength index are bearish.
Figure 7: Rising Oil Futures Prices is Bearish for S&P 500 Industrials
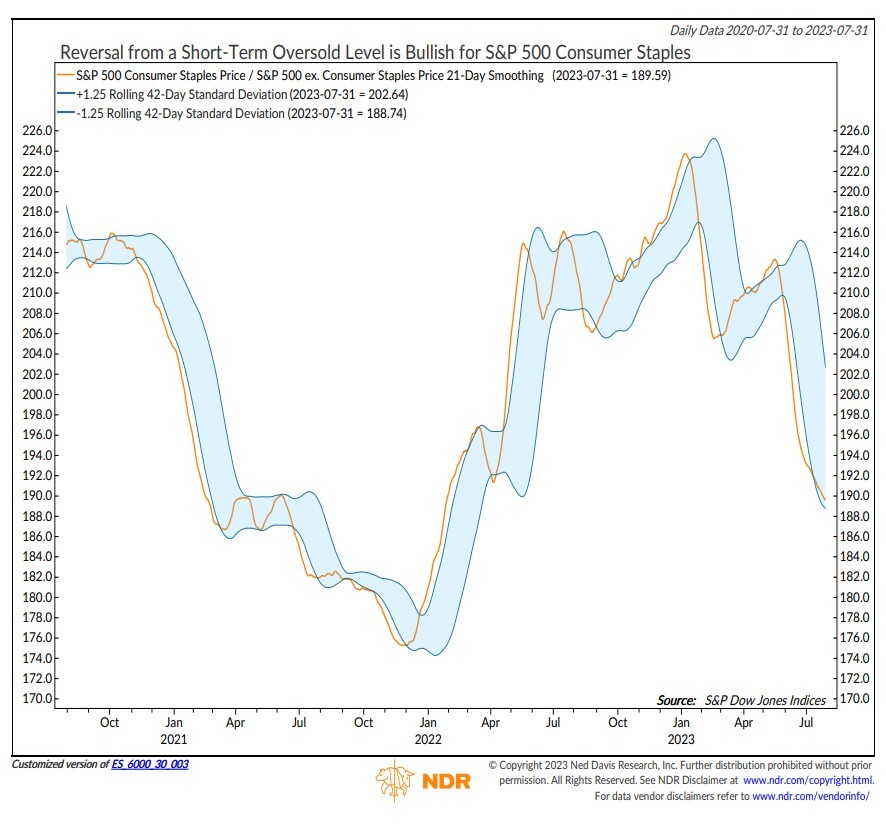
Consumer Staples’ allocation rose slightly in July, but it remains the largest underweight position. The sector was up about 2% in July but lagged the S&P 500 benchmark. On a fundamental basis, credit conditions and economic surprises remain bullish for the sector. However, the majority of external measures are bearish. While most price-based measures are also bearish, a short-term overbought/ oversold indicator moved bullish during the month (Figure 8). Keep in mind, though, relative strength is still very close to the bottom of its recent range, so this indicator could get whipsawed.
Figure 8: Reversal from a Short-Term Oversold Level is Bullish for S&P 500 Consumer Staples
Allocation to the Real Estate sector dropped in July, which moved it to an underweight position. On a fundamental basis, the majority of external indicators are bullish, including business credit conditions which now provide a tailwind for the sector. However, technicals de¬teriorated with an additional indicator flashing bearish during the month (Figure 9).
Figure 9: Relative Price Mean Reversion is Bearish for the S&P 500 Real Estate Sector

Summary
The sector model remained with a mix of cyclical and defensive leadership during the month. Entering August, the sector model is overweight Energy, Health Care, Materials, and Utilities. Information Technology dropped to marketweight. Financials, Consumer Staples, and Real Estate are underweight. The sector model uses sector-specific indicators to determine opportunities and identify risks in an objective, weight-of-the-evidence approach.
NDR Strategists contributing to this publication: Brian Sanborn, CFA, Ed Clissold, CFA, Rob Anderson, CFA, Thanh Nguyen, CFA, Tim Hayes, CMT, Joe Kalish
For more information, please contact us at:
Day Hagan Asset Management
1000 S. Tamiami Trl
Sarasota, FL 34236
Toll Free: (800) 594-7930
Office Phone: (941) 330-1702
Website: https://dayhagan.com/ or https://dhfunds.com/
Strategy Description
- The Smart Sector® with Catastrophic Stop strategy combines two Ned Davis Research quantitative investment strategies: The NDR Sector Allocation and the NDR Catastrophic Stop.
The process is based on the weight of the evidence
- The fund begins by overweighting and underweighting the S&P 500 sectors based on Ned Davis Research’s proprietary sector models.
- Each of the sector models utilizes sector-specific, weight-of-the-evidence composites of fundamental, economic, technical, and behavioral indicators to determine each sector’s probability of outperforming the S&P 500.
- Sectors are weighted relative to benchmark weightings.
When market risks become extraordinarily high — reduce your portfolio risk
- The model remains fully invested unless the Ned Davis Research Catastrophic Sell Stop (CSS) model is triggered, whereupon the equity-invested position is trimmed to 50%.
- The NDR Catastrophic Sell Stop model combines time-tested, objective indicators designed to identify periods of high risk for the broad U.S. equity market. The model uses price-based, breadth, deviation from trend, fundamental, economic, interest rate, behavioral and volatility-based indicator composites.
When market risks return to normal — put your money back to work
- When the NDR CSS model moves back to bullish levels, indicating lower risk, the strategy immediately moves back to fully invested.
For more information, please contact us at:
Day Hagan Asset Management
1000 S. Tamiami Trl
Sarasota, FL 34236
Toll Free: (800) 594-7930
Office Phone: (941) 330-1702
Website: https://dayhagan.com/ or https://dhfunds.com/
Ned Davis Research Disclaimer:
The data and analysis contained within are provided “as is” and without warranty of any kind, either express or implied. The information is based on data believed to be reliable, but it is not guaranteed. NDR DISCLAIMS ANY AND ALL EXPRESS OR IMPLIED WARRANTIES, INCLUDING, BUT NOT LIMITED TO, ANY WARRANTIES OF MERCHANTABILITY, SUITABILITY OR FITNESS FOR A PARTICULAR PURPOSE OR USE. All performance measures do not reflect tax consequences, execution, commissions, and other trading costs, and as such investors should consult their tax advisors before making investment decisions, as well as realize that the past performance and results of the model are not a guarantee of future results. The Smart Sector® Strategy is not intended to be the primary basis for investment decisions and the usage of the model does not address the suitability of any particular investment for any particular investor.
Using any graph, chart, formula, model, or other device to assist in deciding which securities to trade or when to trade them presents many difficulties and their effectiveness has significant limitations, including that prior patterns may not repeat themselves continuously or on any particular occasion. In addition, market participants using such devices can impact the market in a way that changes the effectiveness of such devices. NDR believes no individual graph, chart, formula, model, or other device should be used as the sole basis for any investment decision and suggests that all market participants consider differing viewpoints and use a weight of the evidence approach that fits their investment needs.
DISCLOSURES
Past performance does not guarantee future results. No current or prospective client should assume future performance of any specific investment or strategy will be profitable or equal to past performance levels. All investment strategies have the potential for profit or loss. Changes in investment strategies, contributions or withdrawals and economic conditions may materially alter the performance of your portfolio. Different types of investments involve varying degrees of risk, and there can be no assurance that any specific investment or strategy will be suitable or profitable for a client’s portfolio. Historical performance results for investment indexes and/or categories generally do not reflect the deduction of transaction and/or custodial charges or the deduction of an investment management fee, the incurrence of which would have the effect of decreasing historical performance results. There can be no assurances that a portfolio will match or outperform any particular benchmark.
Day Hagan Asset Management is registered as an investment adviser with the United States Securities and Exchange Commission. SEC registration does not constitute an endorsement of the firm by the Commission, nor does it indicate that the adviser has attained a particular level of skill or ability.
References to “NDR” throughout refer to Ned Davis Research, Inc. Clients engaging in this strategy will be advised by Day Hagan and will not have a contractual relationship with NDR. Day Hagan purchases signals from NDR, and Day Hagan is responsible for executing transactions on behalf of its clients and has discretion in how to implement the strategy.
NDR is a registered as an investment adviser with the Securities and Exchange Commission (SEC). NDR serves as the Signal Provider in connection with this strategy. The information provided here has not been approved or verified by the SEC or by any state or other authority. Additional information about NDR also is available on the SEC’s website at https://www.adviserinfo.sec.gov/. This material is provided for informational purposes only and is not intended as an offer or solicitation with respect to the purchase or sale of any security or other financial instrument or to participate in any trading strategy. NDR’s strategies, including the model discussed in this publication, are intended to be used only by sophisticated investment professionals.
There may be a potential tax implication with a rebalancing strategy. Re-balancing involves selling some positions and buying others, and this activity results in realized gains and losses for the positions that are sold. The performance calculations do not reflect the impact that paying taxes would have, and for taxable accounts, any taxable gains would reduce the performance on an after-tax basis. This reduction could be material to the overall performance of an actual trading account. NDR does not provide legal, tax or accounting advice. Please consult your tax advisor in connection with this material, before implementing such a strategy, and prior to any withdrawals that you make from your portfolio.
There is no guarantee that any investment strategy will achieve its objectives, generate dividends or avoid losses.
© 2023 Ned Davis Research, Inc. | © 2023 Day Hagan Asset Management, LLC
For more news, information, and analysis, visit the ETF Strategist Channel.
