
Originally published by Day Hagen Asset Management on November 4, 2021.
SUMMARY
Based on the November model update, the Day Hagan/Ned Davis Research Smart Sector® with Catastrophic Stop strategy remains fully invested. The Catastrophic Stop model is updated daily.
SECTOR VIEW
Overweight: Consumer Discretionary, Energy, Utilities
Neutral: Consumer Staples, Communication Services, Financials, Industrials, Information Technology, Materials, Real Estate
Underweight: Health Care
THE CATASTROPHIC STOP MODEL REMAINS POSITIVE
The NDR Catastrophic Stop model remains on a fully invested signal.
The NDR Catastrophic Stop model is based on the combination of two proprietary composites: 1) the Internal Composite (technical and price-related indicators) and 2) the External Composite (fundamental, economic, interest rate, and behavioral/sentiment indicators). Each composite is one-half of the overall score.
The Internal Composite improved slightly from last month and is bullish. Momentum, breadth, and trend remain positive. However, volatility is increasing which we view as an early caution sign. We note that the Overbought/Oversold measure is slightly overbought, but not at critical levels.
The External Composite is positive and unchanged from last month. Global trade continues to be robust, and a wider yield curve is positive. Two caution signs are optimistic sentiment and high yield option-adjusted spreads are slightly wider. Like the Volatility indicator, both are early caution signs.
Overall, the weight of the evidence message of the model is bullish on the equity markets. As experienced investors know, optimism and confidence can override weak fundamentals and high valuations for extended periods, but eventually, fundamentals and valuations matter. With this strategy, we are accounting for both price trends and the external environment.
When the Catastrophic Stop issues a sell signal, we will immediately reduce exposure and the accompanying risk.
As Ned Davis Research’s motto states: “See the Signals.”™
OCTOBER SECTOR ALLOCATIONS
Below are selected sector highlights based on NDR Modeling and NDR’s Sector Analysts’ observations:
Communication Services (Neutral): The sector is becoming relatively more overbought. Momentum has peaked and volatility is increasing. The external model is mixed with sales growth trends slowing on a relative basis. Valuations (earnings yield), earnings revisions, and credit spreads are supportive. Though the strong post-pandemic sales trends are softening, we remain neutral until the model’s weight of the evidence confirms the next trend.
Consumer Discretionary (Overweight): The sector was up over 10% last month and the model remains bullish this month with support from the internal and external models. Trend, momentum, and OBOS indicators are positive. Credit conditions, measures of discretionary spending, and interest rates remain supportive. This has occurred with AMZN (21% of the sector ETF) in a short-term downtrend. This speaks to the strength in the rest of the sector, including TSLA (20% of sector), which was up over 43% last month and is now the 5th largest company in the SPY.
Consumer Staples (Neutral): The sector’s internal model deteriorated this month. The operating environment, as illustrated by the sector’s external model, shows that food inflation is negatively impacting the sector, y/y food sales are declining, and improving overall credit conditions are keeping investors focused on risk-on sectors, not on defensive sectors like staples. We note that the relative weakness in the sector has caused relative valuations to improve. However, we remain neutral, in line with the messages of the models until we receive confirmation from the trend indicators and other external indicators that a higher allocation is warranted.
Energy (Overweight): Both the internal and external composites remain extremely bullish. Valuations are still supportive, rig counts are increasing, inventory levels are healthy, and spot prices are supportive. We remain overweight the sector.
Financials (Neutral): The internal model is unchanged from last month while the external model improved. From an external perspective, while Business Credit Conditions are bullish, credit spreads for the sector have widened enough to illustrate that the risk of a potential financial dislocation is growing. The widening is occurring from very low levels and current levels are near historical lows. However, the rate-of-change bears watching closely. With bank loan growth slowing and the Citi G10 Economic Surprise Index showing that recent economic reports are missing expectations, we are on alert. Historically, the drawdowns are negative. The external environment hasn’t fared much better, with Health Care Personal Expenditures still slow, valuations high, weak pricing pressures from health care procedures, and credit spreads also relatively wide. We would also note the potential for legislative policy changes to negatively impact the sector. We remain underweight. Financials sector has been a leading indicator for economic growth and equity market health. Some of this is getting priced in as we note that relative valuations have improved.
Health Care (Underweight): The model weakness we noted last month has continued into this month, with HC having the lowest reading of all 11 sectors. Both the internal and external models are bearish. Price trends, momentum reversals, and larger relative drawdowns are negative. The external environment hasn’t fared much better, with Health Care Personal Expenditures still slow, valuations high, weak pricing pressures from health care procedures, and credit spreads also relatively wide. We would also note the potential for legislative policy changes to negatively impact the sector. We remain underweight.
Industrials (Neutral): As written the last few months, “While capex spending and a potential infrastructure bill would be positive, the model shows that the unemotional weight of the evidence does not yet support an overweight allocation. While investors are optimistic about Congress passing a large-scale infrastructure bill in 2021 to support the economic recovery from the COVID slowdown, our indicators show that for now, much of the enthusiasm is priced in.” There are still more questions than answers regarding the size of the bill, how it would be paid for, and other corporate tax considerations. Volatility is picking up and New 252-day lows are increasing at the same time Momentum and Relative Strength indicators are improving. This is a very mixed message. The external model is still in low-neutral territory. We remain at a neutral allocation.
Information Technology (Neutral): The internal and external models improved slightly as oversold indicators and relative valuations turned positive. As discussed last month, the operating environment (external indicators) remains positive. We needed more evidence that the sector was finding support, and we are now seeing initial indications. We note that inflation, short interest, semiconductor billings, and earnings revisions are supportive. Further model improvement would likely lead to an upgrade.
Materials (Neutral): The sector’s internal and external models improved slightly this month. The sector is back to oversold levels, but requires improvement in momentum, trend, and/or a reversal in volatility (lower) as confirmation that the oversold level will not become more oversold. Interestingly, a measure of Emerging Market strength vs. Developed Markets is now showing Emerging Markets leading. This is positive for the sector. Valuations are also supportive.
Real Estate (Neutral): The sector’s internal model improved while the external model declined. Trend, breadth, and mean reversion (from lower levels) indicators are positive, while the Homebuilders Index, Unemployment, MBA Purchase Index, higher rates, and the weakness in the Citi Economic Surprise Index are negative. We will remain neutral until the indicators form a comprehensive conclusion.
Utilities (Overweight): The sector’s models are still mixed, but the internal composite has improved, and the external model remains bullish. Breadth and price reversals are supportive. Positive external indicators include measures of valuation (earnings yield), manufacturing, and yields on investment grade utilities. Last month, we slightly reduced exposure. This month, our allocation is unchanged.
CHARTS OF INTEREST
Figure 1: As discussed on page one of this publication, we utilize a series of indicators to develop a consensus view on the likelihood that a sector will move higher or lower relative to the other sectors. A broad range of indicators is used, as our experience has shown that when a diverse group of indicators confirm one another, the probability of success is often higher. Below is an example of a Breadth Indictor. Breadth indicators are useful in determining how broad-based the support is for a sector’s move. The higher the proportion of a sector’s constituents heading in the same direction, the stronger the trend. As illustrated in the chart below, when the Information Technology sector’s 50-day Net New Highs are low, the sector has underperformed. When high, illustrating broad-based confirmation of the trend, the sector tends to outperform. This is one of many determinants used to make our allocation decisions. A bullish signal would be generated as the series rebounds from lows showing that more constituents are joining the uptrend and making new highs.
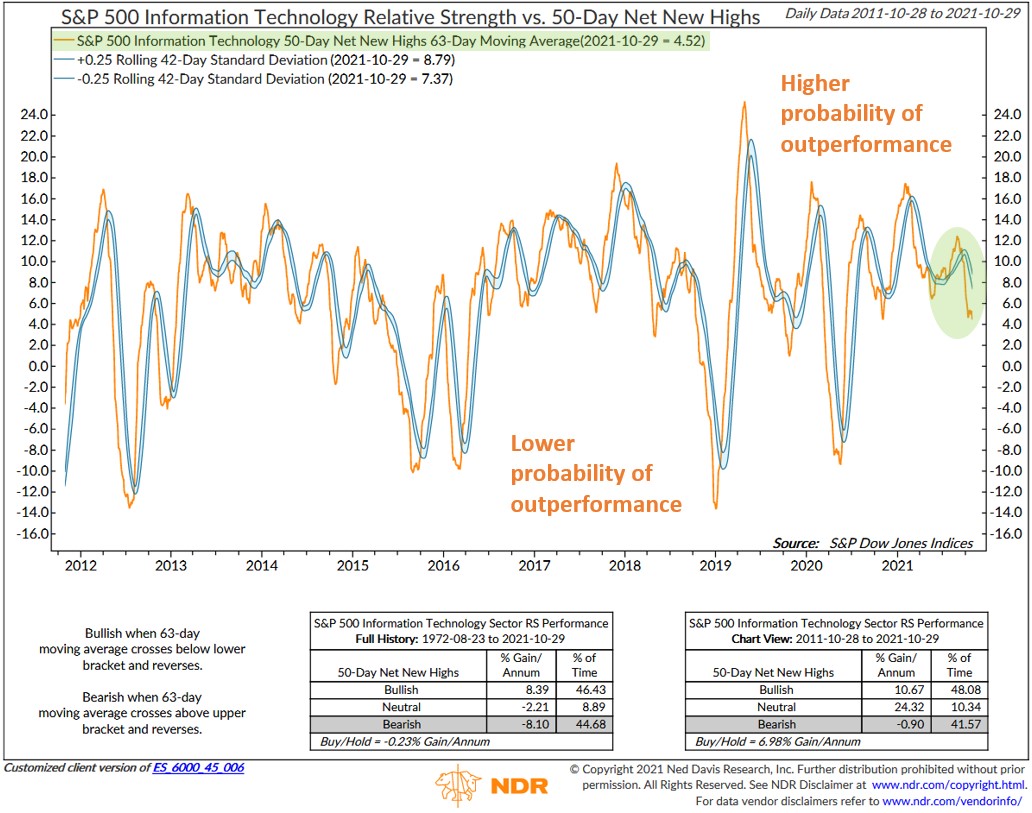
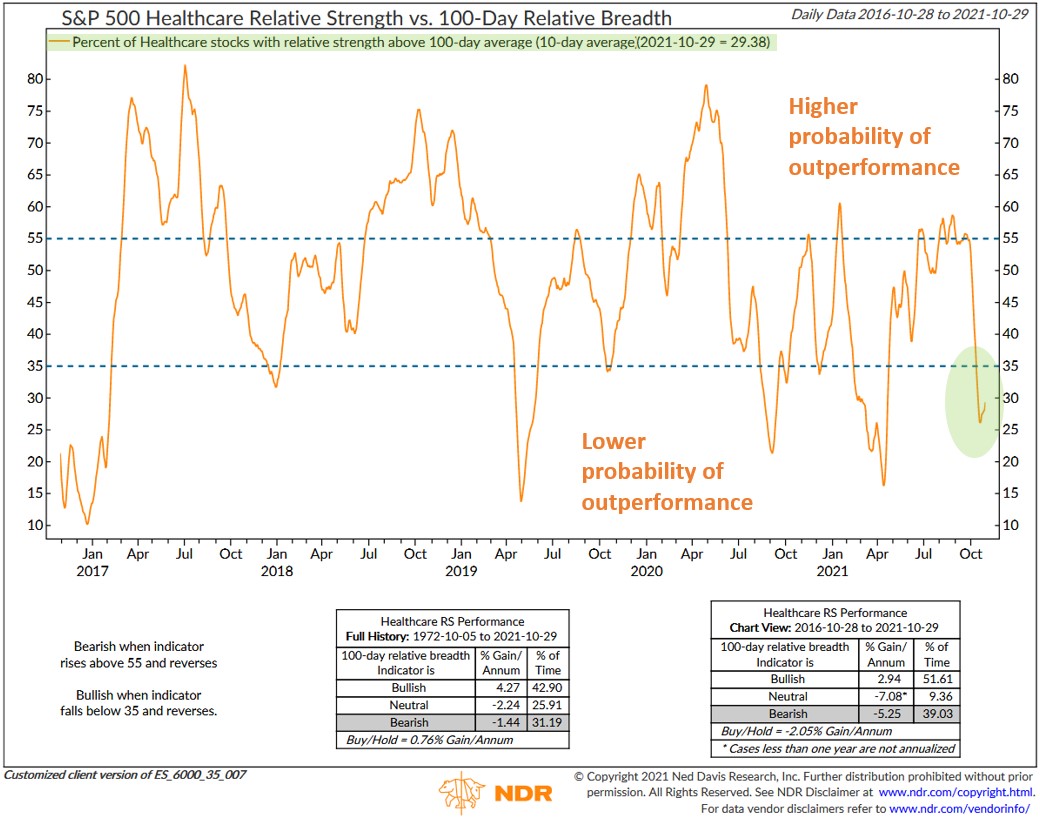
Figure 2: Evaluating the number of stocks hitting New Highs is one way to assess the breadth of participation within a sector. Another method used is to calculate the number of stocks within a sector that are outperforming the rest of the market. The idea being that strength begets strength and often attracts investment and fund flows. This indicator identifies the number of constituents outperforming the market and shows that historically, when the 100-day relative breadth reverses from lower levels to bullish levels, the constituents are “in gear,” and the sector has shown relative strength. The NDR Sector Strategy uses dozens of price-related indicators to identify the sector trends, the breadth of those trends, and the likelihood of continuation. It combines them with external indicators to provide a quantitative, unemotional appraisal of risk vs. reward.
We welcome the opportunity to provide more color on what we are seeing and answer your questions. Please email or call us anytime to set up a webinar or to discuss the strategy and portfolio.
All the best,
Donald L. Hagan, CFA®
Arthur S. Day
Regan Teague, CFA®
P. Arthur Huprich, CMT®
STRATEGY DESCRIPTION
- The Smart Sector® with Catastrophic Stop strategy combines two Ned Davis Research quantitative investment strategies: The NDR Sector Allocation and the NDR Catastrophic Stop.
THE PROCESS IS BASED ON THE WEIGHT OF THE EVIDENCE
- The fund begins by overweighting and underweighting the S&P 500 sectors based on Ned Davis Research’s proprietary sector models.
- The fund begins by overweighting and underweighting the S&P 500 sectors based on Ned Davis Research’s proprietary sector models.
- Each of the sector models utilizes sector-specific, weight-of-the-evidence composites of fundamental, economic, technical, and behavioral indicators to determine each sector’s probability of outperforming the S&P 500.› Sectors are weighted relative to benchmark weightings.
WHEN MARKET RISKS BECOME EXTRAORDINARILY HIGH — REDUCE YOUR PORTFOLIO RISK
- The model remains fully invested unless the Ned Davis Research Catastrophic Sell Stop (CSS) model is triggered, whereupon the equity-invested position is trimmed to 50%.
- The NDR Catastrophic Sell Stop model combines time-tested, objective indicators designed to identify periods of high risk for the broad U.S. equity market. The model uses price-based, breadth, deviation from trend, fundamental, economic, interest rate, behavioral and volatility-based indicator composites.
WHEN MARKET RISKS RETURN TO NORMAL — PUT YOUR MONEY BACK TO WORK
- When the NDR CSS model moves back to bullish levels, indicating lower risk, the strategy immediately moves back to fully invested.
For more news, information, and strategy, visit the ETF Strategist Channel.
NED DAVIS RESEARCH DISCLAIMER
The data and analysis contained within are provided “as is” and without warranty of any kind, either express or implied. The information is based on data believed to be reliable, but it is not guaranteed. NDR DISCLAIMS ANY AND ALL EXPRESS OR IMPLIED WARRANTIES, INCLUDING, BUT NOT LIMITED TO, ANY WARRANTIES OF MERCHANTABILITY, SUITABILITY OR FITNESS FOR A PARTICULAR PURPOSE OR USE. All performance measures do not reflect tax consequences, execution, commissions, and other trading costs, and as such investors should consult their tax advisors before making investment decisions, as well as realize that the past performance and results of the model are not a guarantee of future results. The Sector Allocation Strategy is not intended to be the primary basis for investment decisions and the usage of the model does not address the suitability of any particular investment for any particular investor.
Using any graph, chart, formula, model, or other device to assist in deciding which securities to trade or when to trade them presents many difficulties and their effectiveness has significant limitations, including those prior patterns may not repeat themselves continuously or on any particular occasion. In addition, market participants using such devices can impact the market in a way that changes the effectiveness of such devices. NDR believes no individual graph, chart, formula, model, or other device should be used as the sole basis for any investment decision and suggests that all market participants consider differing viewpoints and use a weight-of-the-evidence approach that fits their investment needs.
DISCLOSURES
Past performance does not guarantee future results. No current or prospective client should assume future performance of any specific investment or strategy will be profitable or equal to past performance levels. All investment strategies have the potential for profit or loss. Changes in investment strategies, contributions or withdrawals and economic conditions may materially alter the performance of your portfolio. Different types of investments involve varying degrees of risk, and there can be no assurance that any specific investment or strategy will be suitable or profitable for a client’s portfolio. Historical performance results for investment indexes and/or categories generally do not reflect the deduction of transaction and/or custodial charges or the deduction of an investment management fee, the incurrence of which would have the effect of decreasing historical performance results. There can be no assurances that a portfolio will match or outperform any particular benchmark.
Day Hagan Asset Management is registered as an investment adviser with the United States Securities and Exchange Commission. SEC registration does not constitute an endorsement of the firm by the Commission, nor does it indicate that the adviser has attained a particular level of skill or ability. Day Hagan Asset Management claims compliance with the Global Investment Performance Standards (GIPS®). GIPS is a registered trademark of CFA Institute. CFA Institute does not endorse or promote this organization, nor does it warrant the accuracy or quality of the content contained herein. Day Hagan Asset Management has been independently verified for the periods June 30, 2008, through December 31, 2020. To receive a GIPS composite report, contact Linda Brown at (941) 330-1702 or email at [email protected].
References to “NDR” throughout refer to Ned Davis Research, Inc. Clients engaging in this strategy will be advised by Day Hagan and will not have a contractual relationship with NDR. Day Hagan purchases signals from NDR, and Day Hagan is responsible for executing transactions on behalf of its clients and has discretion in how to implement the strategy.
NDR is registered as an investment adviser with the Securities and Exchange Commission (SEC). NDR serves as the Signal Provider in connection with this strategy. The information provided here has not been approved or verified by the SEC or by any state or other authority. Additional information about NDR also is available on the SEC’s website at https://www.adviserinfo.sec.gov/. This material is provided for informational purposes only and is not intended as an offer or solicitation with respect to the purchase or sale of any security or other financial instrument or to participate in any trading strategy. NDR’s strategies, including the model discussed in this publication, are intended to be used only by sophisticated investment professionals.
There may be a potential tax implication with a rebalancing strategy. Rebalancing involves selling some positions and buying others, and this activity results in realized gains and losses for the positions that are sold. The performance calculations do not reflect the impact that paying taxes would have, and for taxable accounts, any taxable gains would reduce the performance on an after-tax basis. This reduction could be material to the overall performance of an actual trading account. NDR does not provide legal, tax or accounting advice. Please consult your tax advisor in connection with this material, before implementing such a strategy, and prior to any withdrawals that you make from your portfolio. There is no guarantee that any investment strategy will achieve its objectives, generate dividends, or avoid losses.
© 2021 Ned Davis Research, Inc. | © 2021 Day Hagan Asset Management, LLC
