
By Marc Odo, Swan Global Investments
One of the most frequent questions we receive at Swan Global Investments is, “What is the appropriate benchmark for the Defined Risk Strategy?”
It’s a legitimate question. The Defined Risk Strategy (DRS) is a unique solution and standard off-the-shelf indices aren’t ideal benchmarks. It is important to remember our goal is to outperform both the S&P 500 and a balanced equity/bond portfolio over a full market cycle, which by definition includes both a bull and bear market. However, a full market cycle can take quite a long time to unfold. Just witness our current bull market, now in its eighth year.
How should the DRS’s performance be evaluated over shorter periods of time?
We believe that our Target Return Band is a very appropriate prism through which our performance can be viewed. If our returns fall within this targeted return band in the shorter-term (one year), we believe we will be on track to beat both the market and a balanced equity/bond portfolio over a full market cycle. To review, there are three main elements to the DRSinvestment process:
- A long, buy-and-hold position in ETFs, typically representing 85%-90% of the portfolio
- Long-dated put options used to hedge market risk
- Short-term, market-neutral premium collection trades to generate cash flow
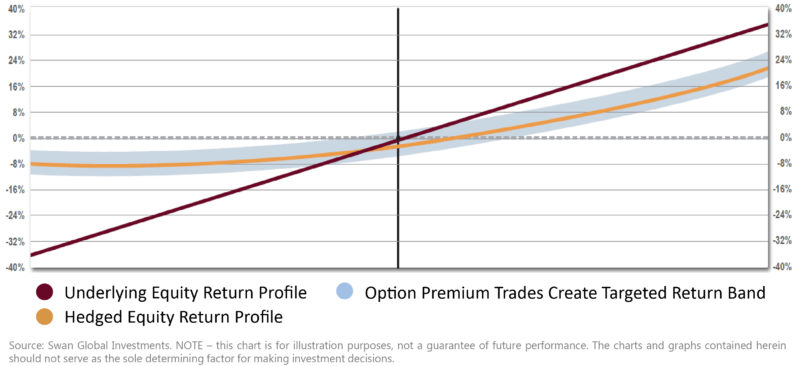
All three elements are represented in the Target Return Band, as shown below. The main idea is that at any given return level of the S&P 500, the DRS’s return should fall either within or above the blue range.
![]()
Understanding the Target (Benchmark)
There are several moving parts to this analysis, so let’s break it down piece by piece.
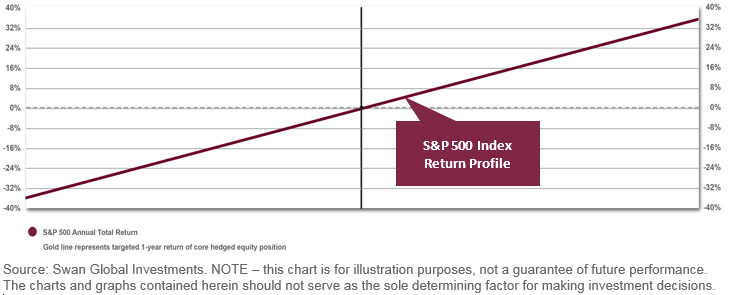
We start with the burgundy colored line, the diagonal like line representing the return profile of the S&P 500.
This element is simple and straight-forward: it represents a long position in passively-managed ETFs. An investment in a S&P 500-based mutual fund or ETF seeks returns that correspond substantially to the returns of the S&P 500 index.
(It should be noted that the large cap Defined Risk Strategy uses an equal-weighted sector approach to its long positions, rather than the capitalization-weighted methodology of the S&P 500. This can lead to some dispersion in performance.)
Hedging to Improve Return Targets
The problem with this kind of passive, buy-and-hold approach is that it has unlimited downside risk. The market can sell off by 20%, 30%, 40% or more, and has done so many times through history. Such losses can be catastrophic and require years for a portfolio to recover.
To protect against these types of major losses, the second component of the DRS is to overlay the ETF positions with put options to hedge against downside risk.
The return profile of this combined equity-and-hedge position is seen in the gold line below:
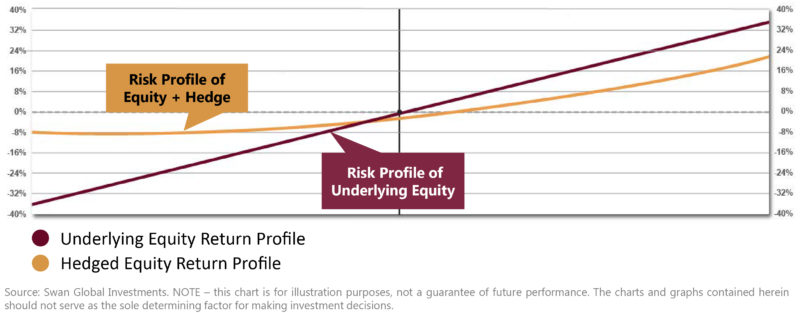
The gold line lags the S&P 500 in up markets but is still upward sloping, so the DRS’s potential upside capture is not capped.
In down markets, however, the value of the hedge is readily evident. As the S&P 500 drops, the hedged equity positions flatten out. At a certain point, the slope of the curve is flat or 0, meaning that the hedged equity position is insulated from further losses in the market. The value of downside protection is clear and is explored in-depth in previous blog posts regarding avoiding large losses and the importance of distribution of returns.
