
By Roman Chuyan, CFA, Model Capital Management
- A recession began in January. An 8% downturn is expected, double the size of 2007-09.
- Our 6m forecast for the S&P 500 remains near -14%; our Short-Term Risk model is now in a Sell position.
- Q2 earnings are expected to drop by 44%.
A parabolic market upswing in early June was interrupted by a 5.8% plunge on June 11th, and the market has traded in a tight range since then, with the S&P 500 up 2% overall in June. Still, the market posted its biggest quarterly gain since 1998 with 22.6%, and it is now only 3% below its Dec-31st level – a remarkable feat considering the economic reality.

Source: Ycharts, as of 6/30/20.
The disconnect between the market and fundamentals remarkably large. I have covered this in detail in my recent articles, – so I’ll offer just a brief recap today. We’re now in a recession that, oddly, began in January even though the pandemic-related lockdowns began in late February. The IMF now expects an 8% cumulative contraction in US GDP this year. If true, it will be double the size of the 2007-09 recession. See Economic Focus below for details.
It’s now clear that the rally was propelled by monetary stimulus – some of the stimulus checks were funneled into the stock market. We don’t know exactly how much, but because the total stimulus was close to $3 trillion, it created a massive new source of short-term demand for stocks. In my view it’s running its course, unless a new round of stimulus is approved.
Quarterly earnings reporting will begin in two weeks. S&P 500 earnings are expected to drop by 44% year-over-year, according to Factset – the largest decline since Q4 2008. This drop is likely understated because many companies have not issued guidance at all (an exception to the SEC rule made for Q2 due to the pandemic). In a “let’s not talk about it” environment, only 49 of the S&P 500 companies issued guidance, less than half of the five-year average of 106.
The S&P 500 price-to-earnings ratio using trailing 12-months operating earnings is 22. It was last at that level in 2017, and before that in 2002. Here’s a good chart by Factset showing that the disconnect between the index and its estimated forward 12-months earnings (which are probably overstated) is the largest in at least ten years:

Our 6-month equity model continues to project a double-digit drop in the S&P 500 of ‑13.6% on negative economic numbers. When the forecast is significantly negative, below -5%, we would always be defensive. In addition, our Short-Term Risk model gave a Sell signal on June 11th. This model has worked very well over the past two years. Even if fundamentals matter less to the market due to the Fed’s actions, we expect this model (which is based on market dynamics) to continue to work well as part of our process.
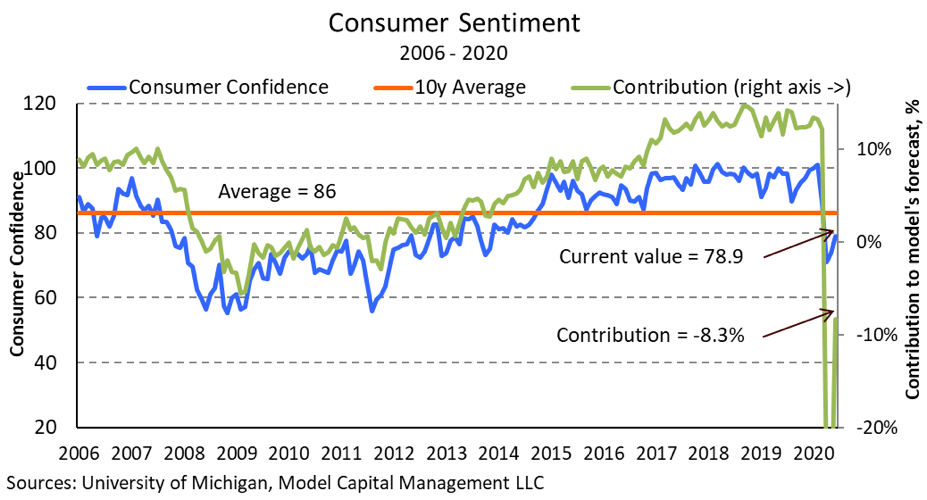
Our equity model’s most negative and positive factors are shown below in historical context (assuming their current weights). After its largest monthly decline on record in April, the University of Michigan’s Consumer Sentiment index rebounded somewhat in the past two months to 78.9. Still, this factor continues to be the most negative in the model with a -8.3% contribution:
Investor sentiment measured by the American Association of Individual Investors’ (AAII) survey turned bearish again in the second half of June on increased market volatility. The bears-to-bulls ratio rose to 1.7, and the effect of this contrary factor at 2.9% remains the most positive factor in the model.
Economic Focus
With May and partial June data available, we now have some visibility into the magnitude of the current recession. The recession began in January, oddly enough, even though the pandemic-related lockdowns began in the US in late February. The IMF now expects an 8% cumulative contraction in US GDP this year. If true, this will be the largest downturn since 1946, double the size of the 2007-09 crisis when US GDP contracted by a cumulative 4%.
The magnitude of monthly changes is enormous as the economy ground to a halt in April and May. There are some bright spots – for example, retail sales jumped by 16.8% in May from the previous month. It appears that Congress and the Fed were successful in boosting spending via stimulus checks. But most data remain terrible. Consumer sentiment – which leads spending – remains low at 78 (see chart) after the largest ever monthly drop in April.

Source: Ycharts
May non-farm payrolls were exceptionally strong – 2.5 million jobs added, compared with consensus expectations of a 9 million loss. The unemployment rate fell to 13.3% (see chart below) from 14.7% in April, also defying economists’ expectations, but remains its highest since at least 1947. Weekly claims for unemployment benefits, although receding, continued at a historically massive level of 1.5 million last week.
About Model Capital Management LLC
Model Capital Management LLC (“MCM”) is an independent SEC-registered investment advisor, and is based in Wellesley, Massachusetts. Utilizing its fundamental, forward-looking approach to asset allocation, MCM provides asset management services that help other advisors implement its dynamic investment strategies designed to reduce significant downside risk. MCM is available to advisors on AssetMark, Envestnet, and other SMA/UMA platforms, but is not affiliated with those firms.
Notices and Disclosures
- This research document and all of the information contained in it (“MCM Research”) is the property of MCM. The Information set out in this communication is subject to copyright and may not be reproduced or disseminated, in whole or in part, without the express written permission of MCM. The trademarks and service marks contained in this document are the property of their respective owners. Third-party data providers make no warranties or representations relating to the accuracy, completeness, or timeliness of the data they provide and shall not have liability for any damages relating to such data.
- MCM does not provide individually tailored investment advice. MCM Research has been prepared without regard to the circumstances and objectives of those who receive it. MCM recommends that investors independently evaluate particular investments and strategies, and encourages investors to seek the advice of an investment adviser. The appropriateness of an investment or strategy will depend on an investor’s circumstances and objectives. The securities, instruments, or strategies discussed in MCM Research may not be suitable for all investors, and certain investors may not be eligible to purchase or participate in some or all of them. The value of and income from your investments may vary because of changes in securities/instruments prices, market indexes, or other factors. Past performance is not a guarantee of future performance, and not necessarily a guide to future performance. Estimates of future performance are based on assumptions that may not be realized.
- MCM Research is not an offer to buy or sell or the solicitation of an offer to buy or sell any security/instrument or to participate in any particular trading strategy. MCM does not analyze, follow, research or recommend individual companies or their securities. Employees of MCM may have investments in securities/instruments or derivatives of securities/instruments based on broad market indices included in MCM Research.
- MCM is not acting as a municipal advisor and the opinions or views contained in MCM Research are not intended to be, and do not constitute, advice within the meaning of Section 975 of the Dodd-Frank Wall Street Reform and Consumer Protection Act.
- MCM Research is based on public information. MCM makes every effort to use reliable, comprehensive information, but we make no representation that it is accurate or complete. We have no obligation to tell you when opinions or information in MCM Research change.
- MCM DOES NOT MAKE ANY EXPRESS OR IMPLIED WARRANTIES OR REPRESENTATIONS WITH RESPECT TO THIS MCM RESEARCH (OR THE RESULTS TO BE OBTAINED BY THE USE THEREOF), AND TO THE MAXIMUM EXTENT PERMITTED BY LAW, MCM HEREBY EXPRESSLY DISCLAIMS ALL WARRANTIES (INCLUDING, WITHOUT LIMITATION, ANY IMPLIED WARRANTIES OF ORIGINALITY, ACCURACY, TIMELINESS, NON-INFRINGEMENT, COMPLETENESS, MERCHANTABILITY AND/OR FITNESS FOR A PARTICULAR PURPOSE).
- “Model Return Forecast” for 6-month S&P 500 return is MCM’s measure of attractiveness of the U.S. equity market obtained by applying MCM’s proprietary statistical algorithm and historical data, but is not promissory, and, by itself, does not constitute an investment recommendation. Model Return Forecasts were calculated and applied by MCM to its research and investment process in real time beginning from 2012. For periods prior to Jan 2012, the results are “back-tested,” i.e., obtained by retroactively applying MCM’s algorithm and historical data available in Jan 2012 or thereafter. Source for the S&P 500 actual returns: S&P Dow Jones.
- Index returns referenced in MCM Research, if any, are gross of any advisory fees, fund management fees, and trading expenses. Fund or ETF returns referenced, if any, are gross of advisory fees and trading expenses. Returns will be reduced by fees and expenses incurred.
