

2. Tariffs
Tariffs, by definition, are always inflationary because they are supposed to negate competitive advantage (whether fair or unfair) by taxing imported lower priced products so that those products’ prices are equal to higher priced domestic ones. Price increases could prove temporary if a tariff’s higher prices stymie demand, but that is less likely to happen now because the underlying economy is quite strong. Because product markets are already tight, tariffs’ impeded flow of goods and services could worsen existing shortages and extended delivery times.
3. Immigration
Of course, one should always want thorough, consistent, and meaningful immigration standards. However, US labor markets are tight, and current immigration discussions are not addressing the need within the US economy for additional labor. Current public policy seemingly ignores that the price of labor (i.e., wages) is already rising because of the growing scarcity of available qualified workers. Labor shortages could easily worsen given the stimulus previously mentioned, but immigration seems unlikely to alleviate even a dramatic labor shortage that could occur.
4. Iran & Oil
One could agree or disagree with the recent positions on Iran. However, oil supplies could be significantly constrained. Chart 6 highlights that oil prices (WTI) have more than doubled since early 2016 largely because of an improving economy. The combination of additional supply restrictions and a strong economy will likely further increase prices.
According to Cornerstone Analytics, a leading independent energy research firm, OPEC does not have enough spare capacity to make up for a full reduction in Iranian exports and non-OPEC production is running near full capacity. If their analysis is correct, then any supply constraints could result in meaningful higher prices.
One should not assume that an increase in energy prices might be temporary. Energy prices would likely have to substantially increase before damaging the US economy. Chart 7 shows gasoline prices as a percent of hourly wages, and the significant increases in gasoline prices so far has equated to a relatively small proportion of wages.
CHART 6:
Weekly Oil (WTI) Prices
(Jul. 14 2008 – Jul. 1 2018)
![]()
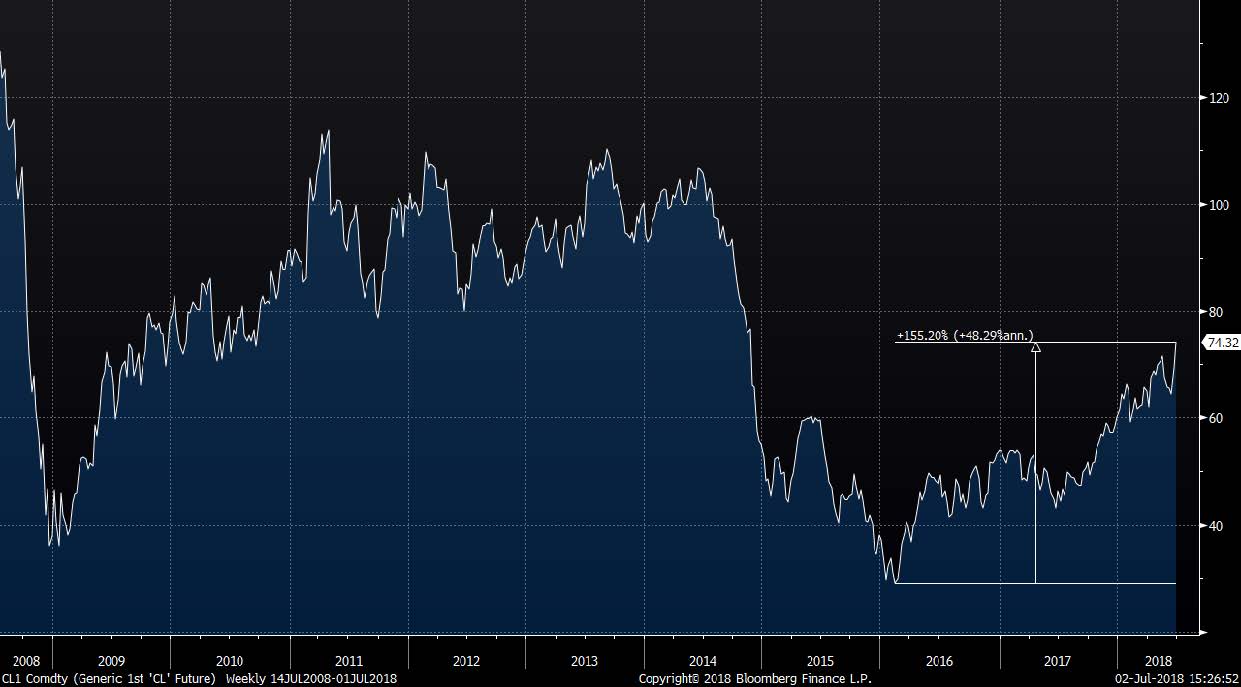
Source: Richard Bernstein Advisors LLC. Bloomberg Finance L.P.
CHART 7:
Price of a Gallon of Gas as a % of Wages
(Jan. 1964 – Jun. 2018)
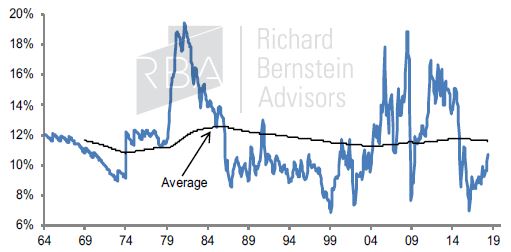
Source: Richard Bernstein Advisors LLC. US EIA, BLS, Bloomberg Finance L.P.
Our positioning for nominal growth still appears unique
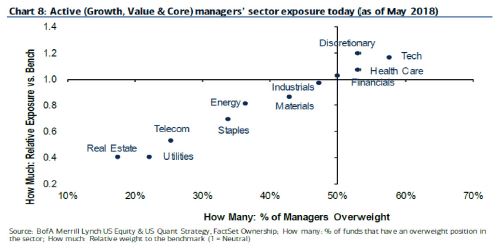
Significant investment opportunities may still exist in sectors that benefit from nominal growth. The chart below, courtesy of BofAML1, highlights that the majority of equity managers are underweighting the sectors that might benefit the most from accelerating nominal growth (Energy, Materials, and Industrials).
Similarly, a recent study by Evercore ISI2 noted that bond portfolio managers had lowered their portfolios’ durations by only a small amount in anticipation of higher interest rates. The latest data suggested that, in aggregate, bond portfolio managers were roughly 92% of benchmark duration versus RBA’s roughly 25-30% of benchmark duration. Overall, both our equity and fixed-income positions seem unique.
CHART 8:
Equity Managers underweight Energy, Materials & Industrials
It is unfortunate that so many investors are enthralled with Washington’s political show rather than remaining dispassionate and objective. At RBA our analyses suggest that accelerating nominal growth may be the next important investment theme, and few investors appear to be appropriately positioned should that occur.
This article was written by Richard Bernstein, Chief Executive and Chief Investment Officer of Richard Bernstein Advisors, a participant in the ETF Strategist Channel.
To learn more about how RBA’s portfolios are uniquely structured, please contact your local RBA representative. www.rbadvisors.com/images/pdfs/Portfolio_Specialist_Map.pdf.
INDEX DESCRIPTIONS:
The following descriptions, while believed to be accurate, are in some cases abbreviated versions of more detailed or comprehensive
definitions available from the sponsors or originators of the respective indices. Anyone interested in such further details is free to consult each such sponsor’s or originator’s website.
The past performance of an index is not a guarantee of future results.
Each index reflects an unmanaged universe of securities without any deduction for advisory fees or other expenses that would reduce actual returns, as well as the reinvestment of all income and
dividends. An actual investment in the securities included in the index would require an investor to incur transaction costs, which would lower the performance results. Indices are not actively managed and investors cannot invest directly in the indices.
CPI: The Consumer prices (CPI) for all Urban Consumers are a measure of prices paid by consumers for a market basket of consumer goods and services. The yearly (or monthly) growth rates represent the inflation rate.
Core CPI : Core Consumer prices are a measure of prices paid by consumers for a market basket of consumer goods and services excluding the Food and Energy categories. The yearly (or monthly) growth rates represent the core inflation rate.
Job Openings: Job Openings and Labor Turnover Survey (JOLTS). JOLTS defines Job Openings as all positions that are open (not filled) on the last business day of the month. A job is “open” only if it meets all three of the following conditions: A specific position exists and there is work available for that position. The position can be full-time or part-time, and it can be permanent, short-term, or seasonal, and The job could start within 30 days, whether or not the establishment finds a suitable candidate during that time, and There is active recruiting for workers from outside the establishment location that has the opening.
Job Seekers: Number of persons unemployed as reported monthly by the Bureau of Labor Statistics (BLS). Data is based on the Current Population Survey (CPS) to measure the extent of unemployment in the country. People are classified as unemployed if they do not have a job, have actively looked for work in the prior 4 weeks, and are currently available for work.