
By Richard Bernstein, Richard Bernstein Advisors
Current US economic fundamentals suggest our portfolios remain correctly focused on assets that benefit from higher inflation. Late-cycle environments are generally characterized by rising inflation, and the current late-cycle is so far mimicking history. Chart 1 shows the increasing year-to-year change in the core and headline CPIs over the past year. The headline CPI is up 65% whereas the more stable core measure is up roughly one-third.
A late-cycle increase in inflation is normal. Product and labor markets tend to tighten, and delays and shortages become more common as increasing activity strains the limits of the economy. It took longer than normal for the recent US economy to reach these late-stage constraints because of the slow growth trajectory of the recovery and expansion. However, the business cycle has not been repealed, and inflation has been building as it always does during late-cycles.
Investors appear unaware of how high US inflation already is relative to inflation rates around the world. Chart 2 shows that the US currently has the highest inflation rate in the world among developed nations.
CHART 1:
Core CPI and CPI YoY
(Jun. 2017 – May 2018)
![]()
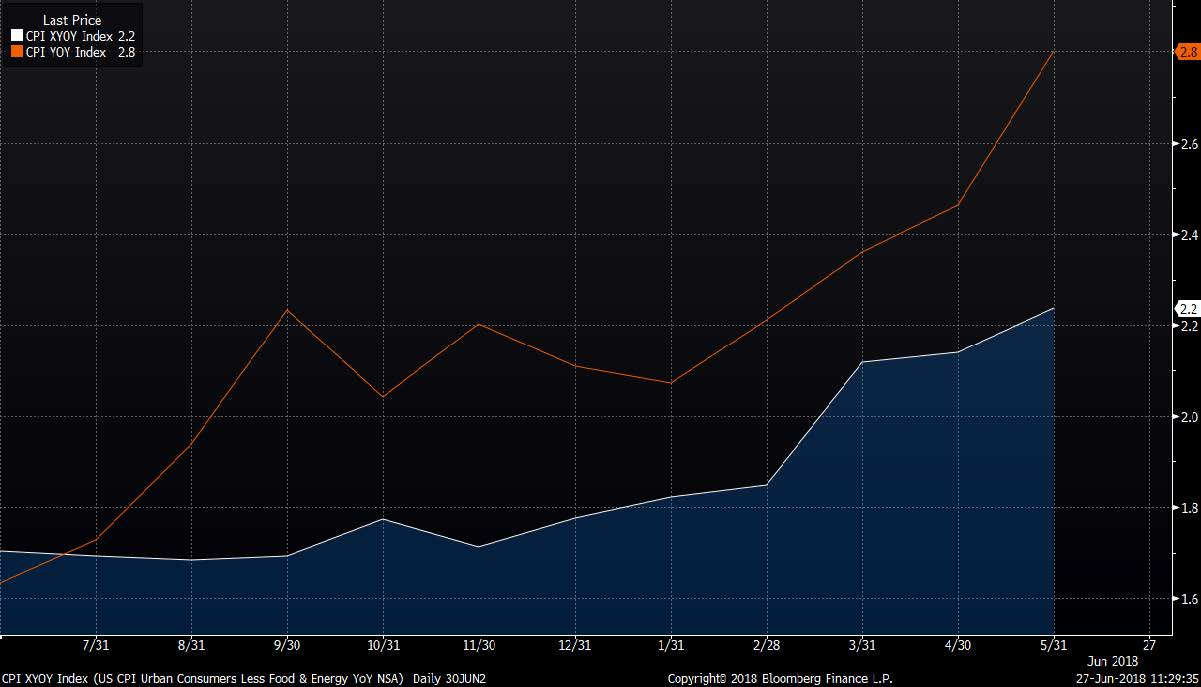
Source: Bloomberg Finance L.P. For Index descriptors, see “Index Descriptions” at end of article.
CHART 2:
Global CPI % YoY
(Latest Available as of Jun. 30 2018)
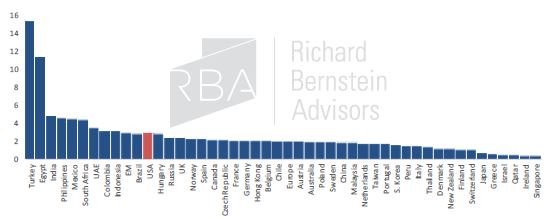
Source: Richard Bernstein Advisors LLC, Standard and Poor’s, Bloomberg Finance L.P.
The limits of the US economy are quickly becoming evident. Product and labor markets have become extremely tight. Chart 3 shows our proprietary measure of vendor delivery time (i.e., how long does it take for a commercial order to be delivered). Longer vendor delivery times suggest demand is outstripping supply, and prices rise when demand is greater than supply. Vendor delivery times are not only lengthening, but are currently among the longest in the history of our data.
CHART 3
US CPI % YoY vs. RBA Vendor Delivery Indicator (Jul. 2001 – Jun. 2018)

Bernstein Advisors LLC, FRB, Bloomberg Finance L.P.
There simply isn’t enough available skilled labor within the US economy. Chart 4 demonstrates that job openings are now the best in the history of the data. Labor markets are like any other product market, and the price of labor (i.e., wages) generally increases when the demand for labor outstrips the supply.
Anecdotal evidence regarding labor union activity also reflects the current tightness of the labor market. Workers typically don’t form unions and strike when they are worried about job security. However, union power is apparently gaining as workers realize replacement workers are very difficult to find.
CHART 4
Job Openings vs. Job Seekers
(Dec. 2000 – Apr. 2018)
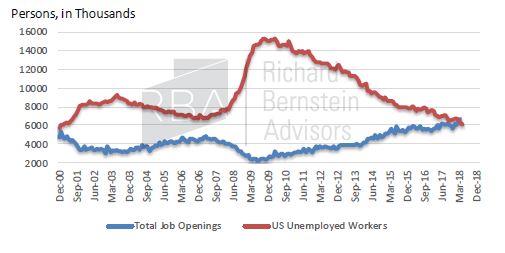
Source: Richard Bernstein Advisors LLC. BLS, Bloomberg Finance L.P. For Index descriptors, see “Index Descriptions” at end of document
Public policy is currently very pro-inflation
Public policy has become a difficult topic about which to discuss. Emotions run high these days, which means that investors must be even more dispassionate and objective when assessing investment opportunities. As mentioned in earlier commentary, RBA tries to solely focus on the investment implications of policy. We are not, in the comments that follow, expressing an opinion that policies are appropriate or not.
Typically, the government uses fiscal stimulus and deficit spending as tools to ameliorate a recession and not to further stimulate the economy during the 9th year of an economic expansion. It is somewhat surprising to us that investors seem more caught up in the political hype of fiscal stimulus than in assessing the investment implications of injecting significant stimulus into a late-cycle economy. It also appears to us as though public policies will exacerbate the late cycle’s bottlenecks, which could further spur inflation. We have considered the inflation potential caused by each of the following policies:
1. Government spending and tax cuts
Both federal and state & local government spending is increasing. Evercore ISI has estimated that spending by the largest states is now rising roughly 6% year-to-year. The federal deficit as a percent of GDP is growing again after decreasing for about six years. Most important, Chart 5 shows that deficits normally contract during latter stages of an economic cycle, but the deficit is increasing during the current late-cycle. Stimulating a late-cycle economy with local, state, and federal stimulus seems likely to overheat an already tight economy and cause inflation that may be significantly higher than most investors are currently forecasting.
CHART 5:
Federal Budget Deficit or Surplus as a % of Nominal GDP
(Dec. 1968 – Mar. 2018)
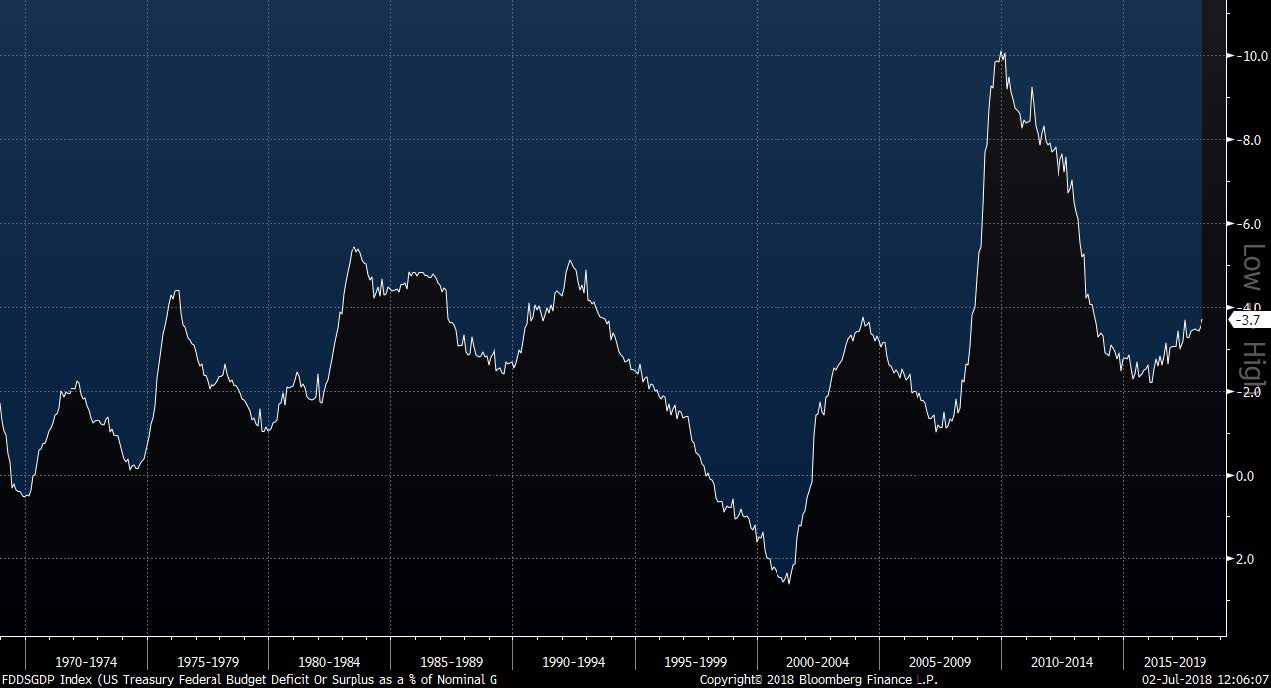
Source: Richard Bernstein Advisors LLC. US Treasury, BEA, Bloomberg Finance L.P.
