

By Corey Hoffstein, Newfound Research
A few weeks ago, we came across a study published by HIMCO on momentum investing*. Contained within this research note was a particularly intriguing exhibit.
![]()
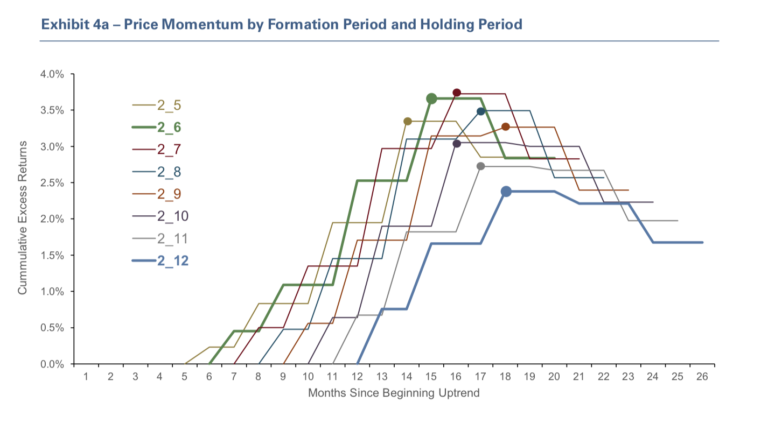
Source: HIMCO Quantitative Insights, May 2018
What this figure demonstrates is that the excess cumulative return for U.S. equity momentum strategies peaks as a function of both formation period and holding period. Specifically, the returns appear to peak when the sum of the formation and holding period is between 14-18 months.
For example, if you were to form a portfolio based upon trailing 6-1 momentum – i.e. ranking on the prior 6-month total returns and skipping the most recent month (labeled in the figure above as “2_6”) – this evidence suggests that you would want to hold such a portfolio for 8-to-12 months (labeled in the figure above as 14-to-18 months since the beginning of the uptrend).
Which is a rather odd conclusion. Firstly, we would intuitively expect that we should employ holding periods that are shorter than our formation periods. The notion here is that we want to use enough data to harvest information that will be stationary over the next, smaller time-step. So, for example, we might use 36 months of returns to create a covariance matrix that we might hold constant for the next month (i.e. a 36-month formation period with a 1-month hold). Given that correlations are non-stable, we would likely find the idea of using 1-month of data to form a correlation matrix we hold for the next 36-months rather ludicrous.
And, yet, here we are in a similar situation, finding that if we use a formation period of 5 months, we should hold our portfolio steady for the next 8-to-10 months. And this is particularly weird in the world of momentum, which we typically expect to be a high turnover strategy. How in the world can having a holding period longer than our formation period make sense when we expect information to quickly decay in value?
Perhaps the oddest thing of all is the fact that all these results center around 14-18 months. It would be one thing if the conclusion was simply, “holding for six months after formation is optimal”; here the conclusion is that the optimal holding period is a function of formation period. Nor is the conclusion something intuitive, like “the holding period should be half the formation period.”
Rather, the result – that the holding period should be 14-to-18 months minus the length of the formation period – makes little intuitive, statistical, or economic sense.
Related: Inferring the Statistics of Buffett’s Alpha
Out-of-Sample Testing with Countries and Sectors
In effort to explore this result further, we wanted to determine whether similar results were found when cross-sectional momentum was applied to country indices and industry groups.
Specifically, we ran three tests.
In the first, we constructed momentum portfolios using developed country index returns (U.S. dollar denominated; net of withholding taxes) from MSCI. The countries included in the test are: Australia, Austria, Belgium, Canada, Denmark, Finland, France, Germany, Hong Kong, Ireland, Israel, Italy, Japan, Netherlands, New Zealand, Norway, Portugal, Singapore, Spain, Sweden, Switzerland, the United Kingdom, and the United States of America. The data extends back to 12/1969.
In the second, we constructed momentum portfolios using the 12 industry group data set from the Kenneth French Data Library. The data extends back to 7/1926.
In the third, we constructed momentum portfolios using the 49 industry group data set from the Kenneth French Data Library. The data extends back to 7/1926.
For each data set, we ran the same test:
- Vary formation periods from 5-1 to 12-1 months.
- Vary holding periods from 1-to-26 months.
- Using this data, construct dollar-neutral long/short portfolios that go long, in equal-weight, the top third ranking holdings and go short, in equal-weight, the bottom third.
Note that for holding periods exceeding 1 month, we employed an overlapping portfolio construction process.
Below we plot the results.

