
![]() By Corey Hoffstein, Newfound Research
By Corey Hoffstein, Newfound Research
When an event with the smallest odds meets a long enough horizon, or large enough sample size, the occurrence becomes a near certainty.
Flipping 50 heads in a row with a fair coin has the infinitesimally small probability of 8.9e-16 (smaller than a millionth of a millionth of a percent). Try it 5,184,960,683,398,419 times, however, and there is a large degree of certainty you’ll see the magic 50 heads (<1% chance you will not). Whether you see it the first trial, the tenth, the 900billionth – or get unlucky and do not see it at all – has nothing to do with skill, just randomness.
With this in mind, we ask a simple question: Is Warren Buffett’s track record evidence of inefficient markets or was it eventually guaranteed by randomness?
Let’s put some numbers behind it. Specifically, we will take the monthly returns of BRK-A1 and perform a standard CAPM regression to identify Buffett’s alpha (i.e. his excess return), his beta (i.e. sensitivity to the market), and his idiosyncratic risk (i.e. the random stuff left over).2
With a long-term beta of just 0.65, Buffett has generated an annualized alpha of 9.86% with idiosyncratic volatility of 19.26%.
If we assume a null hypothesis that his actualalpha is 0% – implying that his realized 9.86% was the result of luck and not skill – the probability of seeing a result this good, or better, is a mere 0.07%.3
Which seems exceedingly low. By conventional statistical standards, we would rejectthe null hypothesis that Buffett’s alpha is equal to zero with 99.93% confidence. Note that we did not say that we accept that Buffett has a positive alpha. In statistics we only rejector fail to reject. This is a nuance, but we believe the language holds important meaning: there is always a probability our interpretation of the data is wrong.
Another way of looking at this data, however, is saying that if another investor had started back in 1980 on the same date and invested randomly with a constant 19.26% idiosyncratic volatility, there is a 99.93% chance they would have underperformed Buffett’s track record through today.
Tiny probabilities compound rapidly in large groups when the samples are independent, however. So how many investors would need to invest in such a manner before there is a <1% chance that they all underperform Buffett?
Just 5,875.
All of a sudden, Buffett does not seem quite as special.
Below we simulate exactly this exact concept. Starting in 1980, we simulate out the excess returns of 10,000 investors who have zero expected alpha but an idiosyncratic volatility of 19.26%. Those investors that outperformed Buffett’s track record (blue) are highlighted in orange.
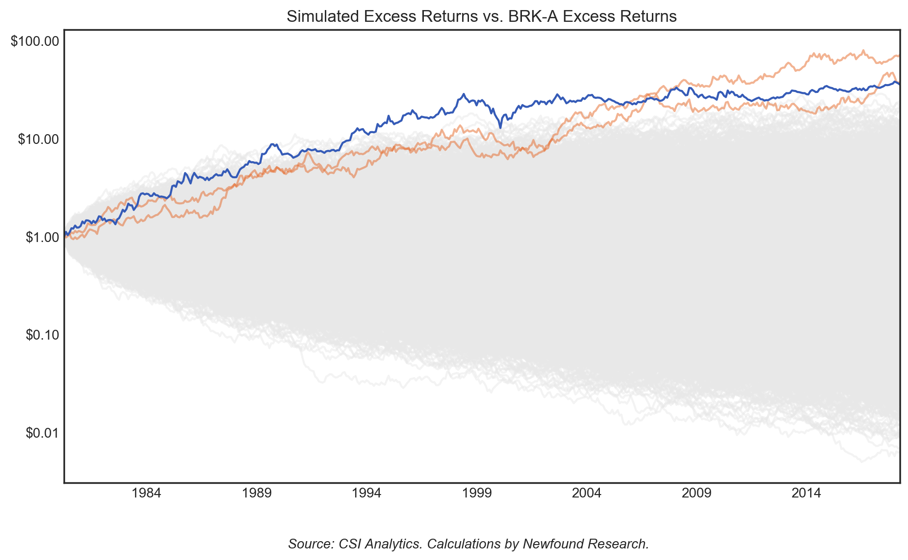
Surely there were more than 10,000 investors in 1980. So where are the other lucky multi-billionaires?
