
RATES LOWER FOR LONGER, PROVIDING ECONOMIC BACKSTOP
By Riverfront Investment Group
Last week, the Fed committed to leaving the federal funds rate at or near zero for the foreseeable future, as it left rates unchanged at the FOMC meeting. We believe that the Fed has taken this stance with the following goals in mind:
- Help spur employment growth and increase inflation simultaneously, which helps the Fed get closer to meeting the obligations of its dual mandate.
- Provide further access to credit at lower levels for corporations dealing with pandemic aftershocks.
A lot has transpired in the financial markets in just three months. We have experienced a global pandemic that led to an economic lockdown which ended the longest economic expansion in the history of the country. The aftershocks of the pandemic saw equity markets plummet 34%, only to recoup more than 95% of those losses from the S&P 500’s all-time closing high of 3,386 as the economy gradually reopened… before selling off again last week.
“Don’t Fight the Fed”: Bold Policies Spur Market Rebound
One of our rules for tactical portfolio decisions is our mantra “Don’t Fight the Fed,” and the recent stock market rebound is a good example. This epic recovery of fortunes in the market is in part due to the fiscal and monetary stimulus by the US government and the Federal Reserve, in our view. While cuts in the federal funds rate and fiscal stimulus like the Paycheck Protection Program garner the most attention, we believe other monetary programs have been equally impactful. For example, the Fed’s explicit backstop for investment grade corporate bonds and its implicit backstop for double-B rated high yield securities, which we highlighted in the May 4th edition of the Weekly View, were significant. We believe the mere presence of the Fed has helped lower the credit risk premium for both asset classes considerably since our publication, thus providing liquidity for corporations seeking to borrow money to fortify their balance sheets during a time of uncertainty. In addition to these credit facilities, many have overlooked the impact the Fed has had on the yield curve and the implications that follow.
What is a Yield Curve?
The yield curve represents the relationship between short and long-term interest rates. A line drawn through the different interest rate maturities, from the federal funds overnight rate to 30-year bond yields, is rarely a straight line and so often resembles a curve. Most of the time, this curve is upward sloping, with short-term interest rates typically lower than long-term interest rates. This is because investors demand a premium for having their rates fixed for longer periods of time.
Shape of the Yield Curve: Fed Policy Avoids Inversion
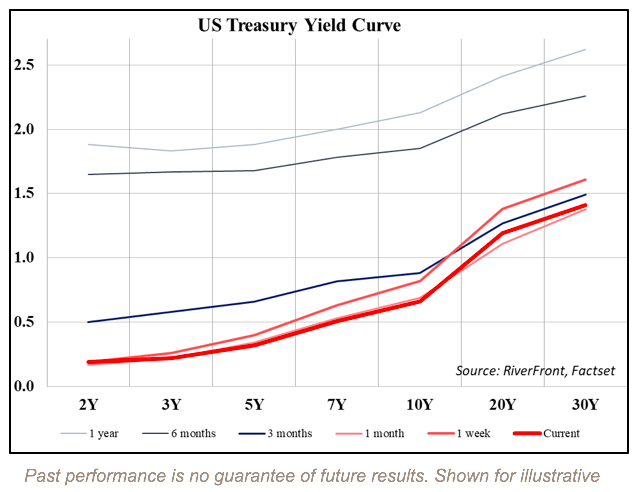
On February 28th, just two weeks prior to the US beginning to lockdown the economy, the yield curve only had a 76- basis point (basis point = 1/100th of 1%) spread differential between an US Government Treasury bond maturing two years and one maturing in thirty years. This relatively flat yield curve reflected investors’ views that inflation would not increase significantly due to the expected contraction in economic growth. For the Fed, a flat yield curve can be problematic as it could trigger deflation which would threaten the Fed’s mandate of price stability and possibly negatively impact its employment mandate. At the end of February, the unemployment rate was 3.5% and not an issue, and the Fed’s preferred gauge for inflation, core PCE, was 1.80% and only slightly below its 2% inflation target. Today the unemployment rate has risen to 13.3% and core PCE has fallen to 1.04%, well below the Fed’s 2% target, and achievement of their dual mandate is now in jeopardy.
In reaction to the pandemic, the Fed cut interest rates twice totaling 150 basis points, anchoring the fed funds target rate near zero and relaunching its bond buying program, known as Quantitative Easing (QE). The Fed’s QE program helped set the stage for the steepening of the yield curve by forcing short-term interest rates lower through its purchases of agency bonds and Mortgage-Backed Securities. The process expanded the Fed’s balance sheet from $4.15 trillion on February 26th, to its current $7.16 trillion and steepened the two to thirty-year yield curve by roughly 60 basis points. The yield curve now signals that inflation could increase as growth prospects improve for the economy over time.
Yield Curve Control: Another Potential Tool in the Policy Toolbox
One tool that is under consideration by the Fed to help with management of the yield curve, is Yield Curve Control (YCC). Under this process, the Fed would place caps on interest rates for specific maturities along the yield curve. The Fed would then buy bonds at those maturities to ensure rates stayed below their caps, effectively making its QE program unlimited. YCC in the US is not unprecedented, as the Fed undertook similar action after WWII holding short rates at .375% and long rates at 2.50% for an extended period to help finance the accumulated debts of the war. In the 2020 version, the Fed would be capping rates to finance the debts created from the pandemic fiscal and monetary programs. We believe that the Fed will delay implementing YCC if current monetary policies are working. However, if the yield curve becomes problematic to Fed policy in the future, we would expect to see YCC put in place. For now, the Fed wants to preserve its firepower by not emptying its toolbox.
Below you can view how steep the yield curve is currently relative to various timeframes over the last year.
Portfolio Implications: Fed Action Supportive of Stock Market, In Our Opinion
In our view, the Fed remains on the investor’s side and Yield Curve Control, if implemented, would be further reinforcement. Therefore, we have chosen to position our portfolios in order to take advantage of current Fed policy. We have lowered our fixed income exposure and reduced our exposure to longer-dated Treasuries as the US Treasury begins funding the $3 trillion coronavirus aid.
Additionally, we have added more equity exposure across the portfolios as we believe that the S&P could eventually retest the February 19th closing high of 3,386. We recognize that concerns over a COVID-19 ‘second wave’ may cause renewed market volatility in the near-term, but believe that Fed policy helps provide a floor for the economy and the stock market. As always, our tactical and risk management processes will evaluate the health of the recent uptrend and act accordingly.
Important Disclosure Information
The comments above refer generally to financial markets and not RiverFront portfolios or any related performance. Opinions expressed are current as of the date shown and are subject to change. Past performance is not indicative of future results and diversification does not ensure a profit or protect against loss. All investments carry some level of risk, including loss of principal. An investment cannot be made directly in an index.
Information or data shown or used in this material was received from sources believed to be reliable, but accuracy is not guaranteed.
This report does not provide recipients with information or advice that is sufficient on which to base an investment decision. This report does not take into account the specific investment objectives, financial situation or need of any particular client and may not be suitable for all types of investors. Recipients should consider the contents of this report as a single factor in making an investment decision. Additional fundamental and other analyses would be required to make an investment decision about any individual security identified in this report.
In a rising interest rate environment, the value of fixed-income securities generally declines.
High-yield securities (including junk bonds) are subject to greater risk of loss of principal and interest, including default risk, than higher-rated securities.
Stocks represent partial ownership of a corporation. If the corporation does well, its value increases, and investors share in the appreciation. However, if it goes bankrupt, or performs poorly, investors can lose their entire initial investment (i.e., the stock price can go to zero). Bonds represent a loan made by an investor to a corporation or government. As such, the investor gets a guaranteed interest rate for a specific period of time and expects to get their original investment back at the end of that time period, along with the interest earned. Investment risk is repayment of the principal (amount invested). In the event of a bankruptcy or other corporate disruption, bonds are senior to stocks. Investors should be aware of these differences prior to investing.
You cannot invest directly in an index
Standard & Poor’s (S&P) 500 Index measures the performance of 500 large cap stocks, which together represent about 80% of the total US equities market.
Definitions:
A basis point is a unit that is equal to 1/100th of 1%, and is used to denote the change in a financial instrument. The basis point is commonly used for calculating changes in interest rates, equity indexes and the yield of a fixed-income security. (bps = 1/100th of 1%)
Don’t Fight the Fed – ‘Supportive’ means the Fed’s monetary policy regarding inflation and employment is in what we believe based on our analysis to be the investors’ best interest; ‘Against’ means the Fed’s monetary policy, in our view, is going against the investors’ best interest; ‘Neutral’ means the Fed’s monetary policy is neither supportive or against the investors’ best interest in our view.
RiverFront Investment Group, LLC (“RiverFront”), is a registered investment adviser with the Securities and Exchange Commission. Registration as an investment adviser does not imply any level of skill or expertise. Any discussion of specific securities is provided for informational purposes only and should not be deemed as investment advice or a recommendation to buy or sell any individual security mentioned. RiverFront is affiliated with Robert W. Baird & Co. Incorporated (“Baird”), member FINRA/SIPC, from its minority ownership interest in RiverFront. RiverFront is owned primarily by its employees through RiverFront Investment Holding Group, LLC, the holding company for RiverFront. Baird Financial Corporation (BFC) is a minority owner of RiverFront Investment Holding Group, LLC and therefore an indirect owner of RiverFront. BFC is the parent company of Robert W. Baird & Co. Incorporated, a registered broker/dealer and investment adviser.
To review other risks and more information about RiverFront, please visit the website at www.riverfrontig.com and the Form ADV, Part 2A. Copyright ©2020 RiverFront Investment Group. All Rights Reserved. ID 1215283
