
By Art Huprich, CMT®
Summary
Higher interest rates are weighing on equities, and focus will be on the Fed’s conference this week.
Speaking of Intimidation
“I used to think that if there was reincarnation, I wanted to come back as the President, or the Pope, or as a .400 baseball hitter. But now, I would want to come back as the bond market. You can intimidate everybody.” James Carville’s words hit the nail on the head last week as higher interest rates (Figure 1) weighed on equities, especially large cap growth-oriented/technology. The technology-heavy NASDAQ 100 has declined in four of the past five weeks. In like fashion, last week was the third straight down week for the technology-heavy S&P and NASDAQ. A Small Cap proxy has also declined for three consecutive weeks. Meanwhile, DJIA has fallen two of the last three weeks.
Figure 1: 10-Year U.S. Treasury Yield Index (43.42 = 4.34%). Closing prices shown. | Even with hiccups (pullbacks) along the way, which wouldn’t surprise me, this chart configuration wants to go higher.
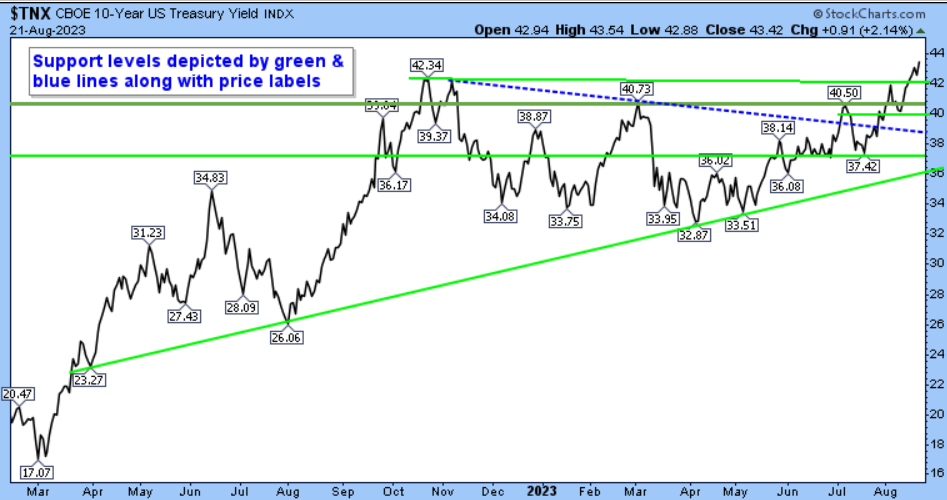
Figure 1 aside, another consequence might eventually become more apparent in the housing market. While not close to my first mortgage, which was over 13%, 30-year fixed-rate mortgages topped 7%, marking the highest levels in more than 20 years.
The recent bump in interest rates has caused domestic indices to come down and test, and thus far hold, initial support—Figures 2-4. The quality of any future rallies/rally attempts will help determine its sticking power. To paraphrase from a recent report, a guidepost for when the current short-term pullback may end will be when a “higher/stronger open, weak/lower close” no longer occurs or when market indices open weaker (lower) and close strong (up or well off their intraday low).
Figure 2: S&P 500 with 21-day MA, 50-day MA, and 150-day MA. | Important levels of underlying support are depicted below, as are areas of selling pressure (resistance—red lines). A close above 4450 to 4455 would solidify the initial layer of support between 4335 and 4325+/-.
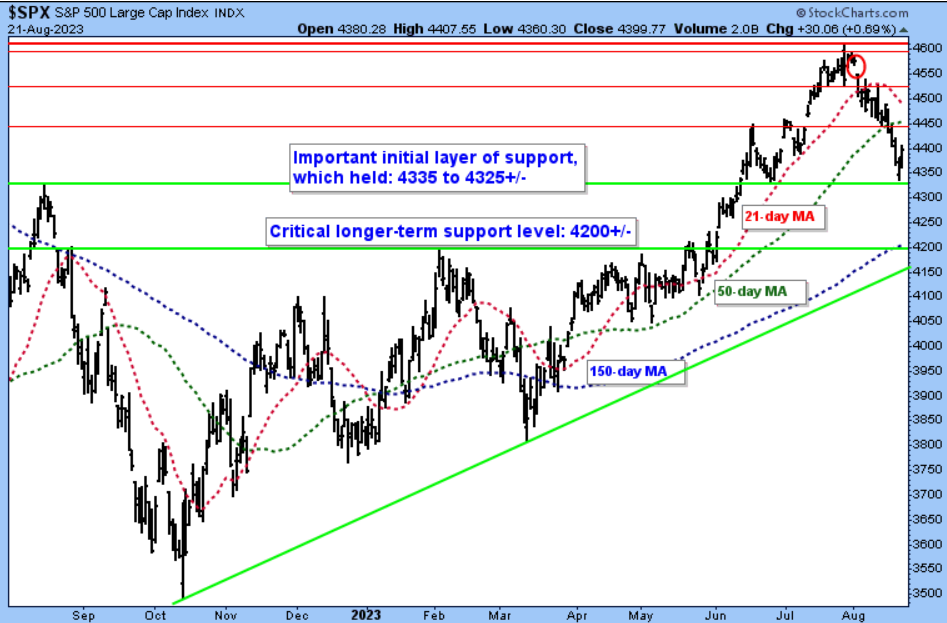
Figure 3: Small Cap proxy with Stochastics indicator (overbought/oversold). | Let’s keep it simple (KISS)—red lines and price labels = resistance; green lines and price labels = support. Within a wide trading range, there has been a decline down to support. Consequently, some type of near-term, oversold (stochastics—lower frame, green line) rally attempt should occur from this area.
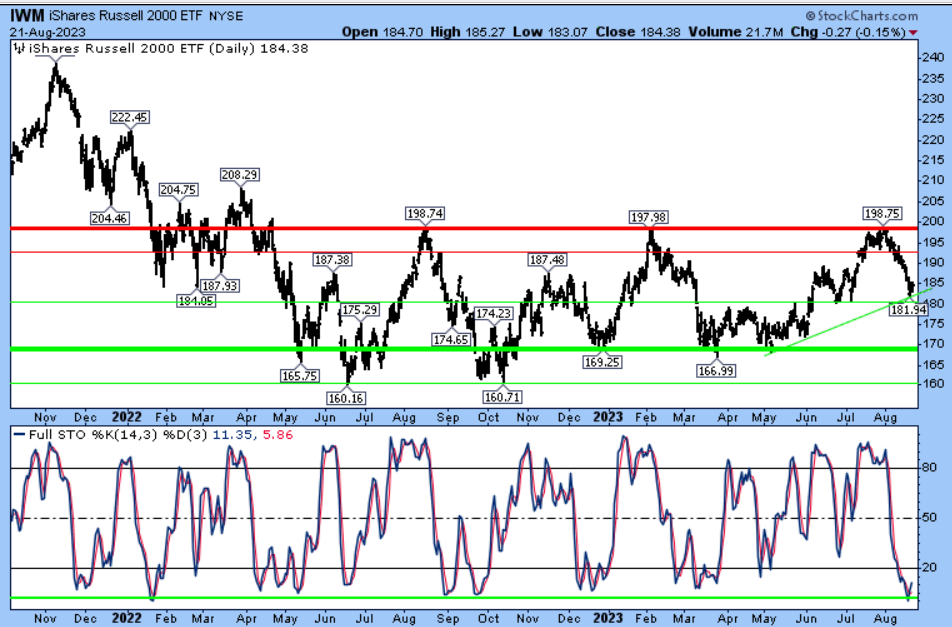
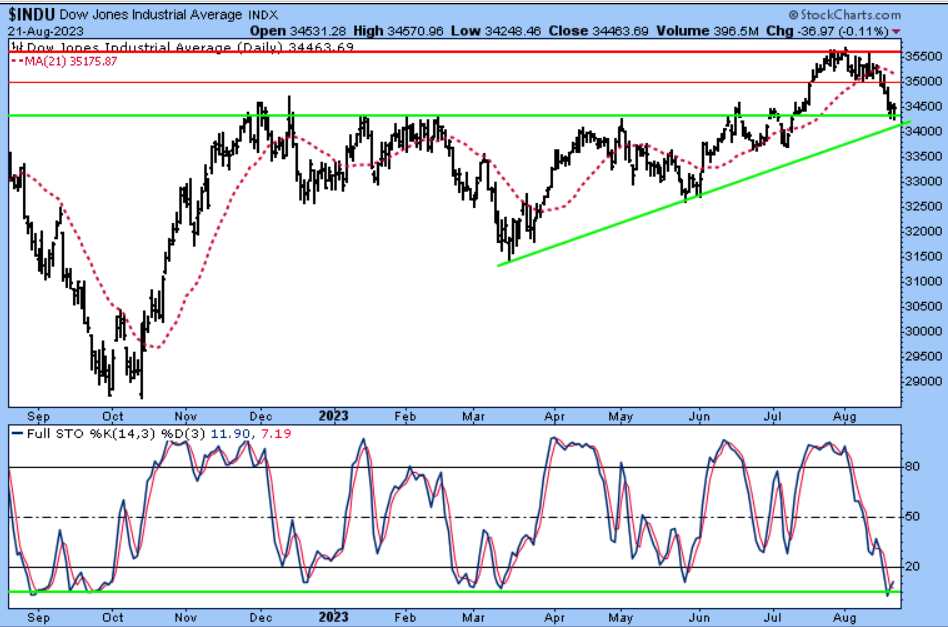
Figure 4: DJIA (cyclical oriented) with Stochastics indicator (overbought/oversold). | KISS—green lines = support; red lines = resistance. There has been a decline down to support. Consequently, some type of near-term, oversold (stochastics—lower frame, green line) rally should occur from this area.
Please let me know if you would like to schedule a call to go over the process and discipline underpinning our Smart Sector with Catastrophic Stop, Smart Sector International, and/or Smart Sector Fixed Income strategies.
Day Hagan Asset Management appreciates being part of your business, either through our research efforts or investment strategies. Please let us know how we can further support you.
Art Huprich, CMT®
Chief Market Technician
Day Hagan Asset Management
—Written 08.21.2023. Chart source: Stockcharts.com unless otherwise noted.
Disclosure
The data and analysis contained herein are provided “as is” and without warranty of any kind, either express or implied. Day Hagan Asset Management (DHAM), any of its affiliates or employees, or any third-party data provider, shall not have any liability for any loss sustained by anyone who has relied on the information contained in any Day Hagan Asset Management literature or marketing materials. All opinions expressed herein are subject to change without notice, and you should always obtain current information and perform due diligence before investing. DHAM accounts that DHAM, or its affiliated companies manage, or their respective shareholders, directors, officers and/or employees, may have long or short positions in the securities discussed herein and may purchase or sell such securities without notice. The securities mentioned in this document may not be eligible for sale in some states or countries, nor be suitable for all types of investors; their value and income they produce may fluctuate and/or be adversely affected by exchange rates, interest rates or other factors.
Investment advisory services offered through Donald L. Hagan, LLC, a SEC registered investment advisory firm. Accounts held at Raymond James and Associates, Inc. (member NYSE, SIPC) and Charles Schwab & Co., Inc. (member FINRA, SIPC). Day Hagan Asset Management is a dba of Donald L. Hagan, LLC.
For more information, please contact us at:
Art Huprich, CMT
For more information, please contact us at:
Day Hagan Asset Management
1000 S. Tamiami Trl
Sarasota, FL 34236
Toll Free: (800) 594-7930
Office Phone: (941) 330-1702
Website: https://dayhagan.com or https://dhfunds.com
For more news, information, and analysis, visit the ETF Strategist Channel.
