
Summary
Within the context of a multi-month trading range, internal measuring statistics (outperformance by equal-weighted equity index proxies, improving number of new 52-week highs/contracting number of new 52-week lows, NYSE Advancing volume, etc.), aided by a further decline by the U.S. Dollar, are supporting a move higher by the S&P 500—towards 4050-4100+/-.
Sub or Grinder
Year-end weakness (tax loss selling) from a few components dictated the directional moves of cap- and price-weighted indices into year-end 2022. This masked short-term internal improvement. Consequently, the current equity market takes me back over 40 years ago to college, when my friends and I were lamenting over our beloved, yet unavailable, sub sandwich. My roommate referred to it as a grinder, and the rest of us laughed, having never heard that term used before. He pulled out the dictionary and proved us wrong—humbling given the grief we gave him. Over the past number of weeks/months, Wall Street has experienced its own version of a “grinder,” and not in a tasty way. In this case “grinder” is defined as boring, tedious drudgery: working hard, exhausting to mind or body, with no visible return. Until the upper resistance lines are violated, which will take a lot more time, the grind will continue. Figures 1-3.
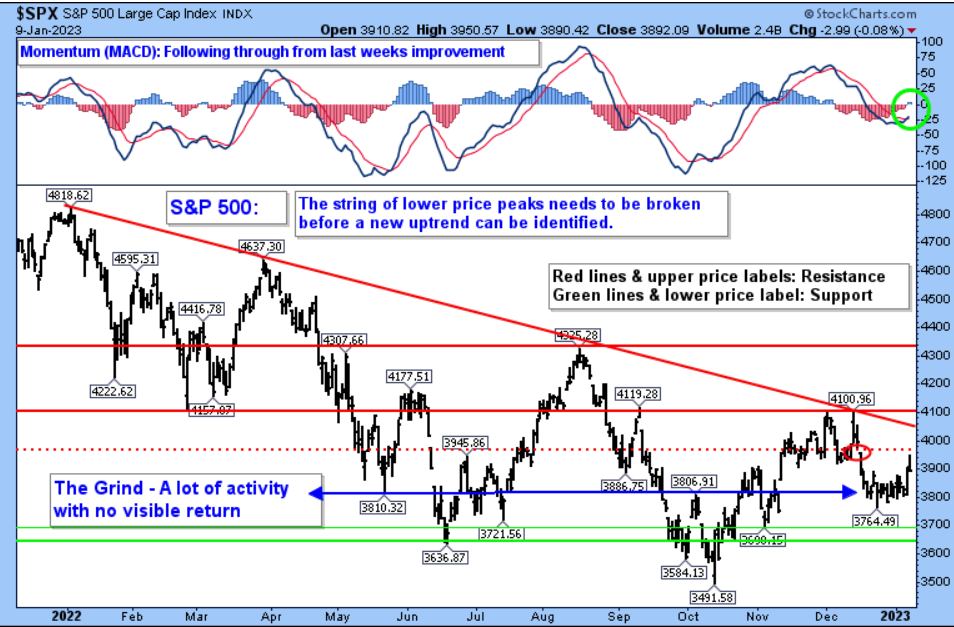
Figure 1: S&P 500. | Resistance = 3966 (gap), 4050 to 4100+/- and 4300+/- (August peak). Support = 3764, 3700+/-, and 3550+/-.
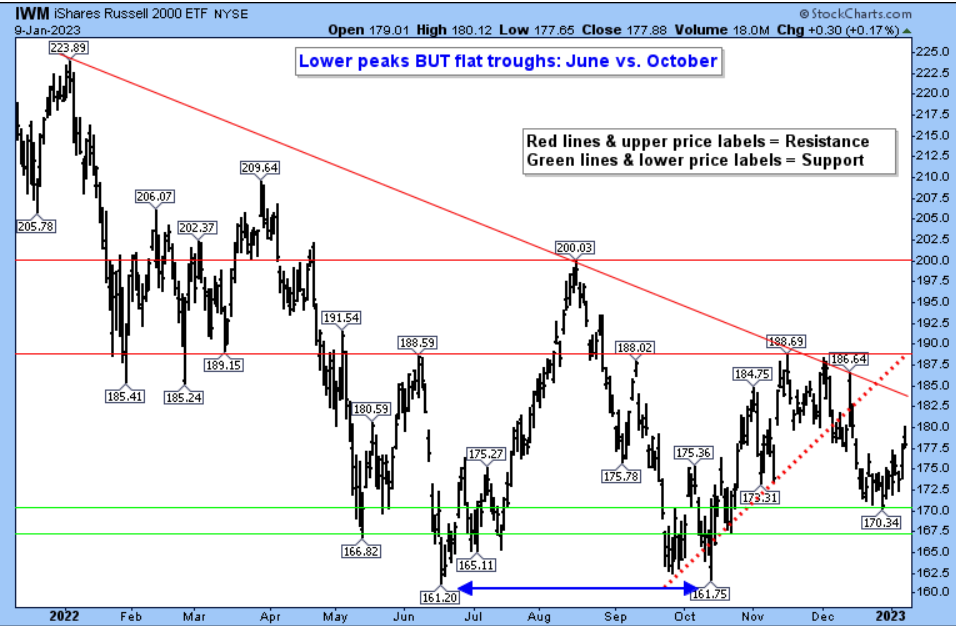
Figure 2: iShares Russell 2000 ETF – Small Cap proxy. | Let’s keep it simple. Please refer to verbiage inside the chart.
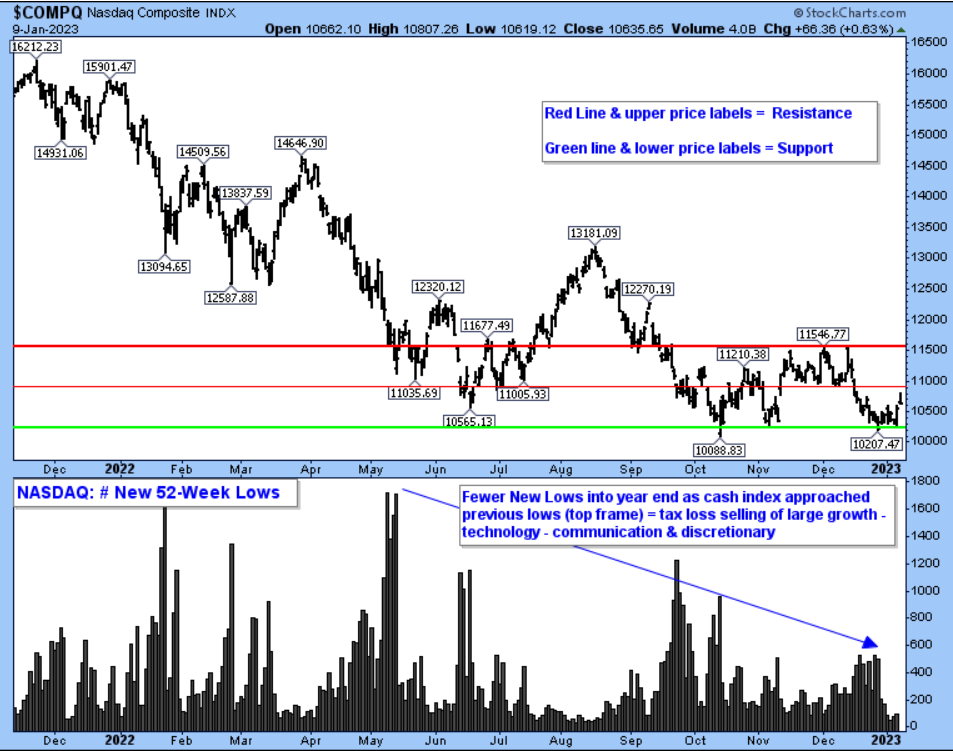
Figure 3: NASDAQ. |The Grind is readily visible—“Bounce now or forever hold your peace.”
Follow-up
Having highlighted the U.S. Dollar Index in last week’s report and the bullish implications for equities of a breakdown, here is a follow-up chart plus some pertinent comments from my colleague, Don Hagan, discussing inflation and the NDR Inflation Timing Model:
“There will be another CPI report on Thursday and headline year-over-year inflation is expected to drop from 7.1% to 6.5% or so. With that in mind… the NDR Inflation Timing Model first moved above 0 on 11-30-2020, presaging inflation well before most market participants were giving it a second thought. Subsequently, the model moved below 0 in August, illustrating that inflation had likely peaked. Current levels indicate that inflationary pressures are likely to continue to weaken. Interestingly, NDR has been discussing the impact of declining shelter prices (a large part of the core inflation calculation), and the likelihood that it will continue to factor into a lower inflation print.”
Please reach out for the chart.
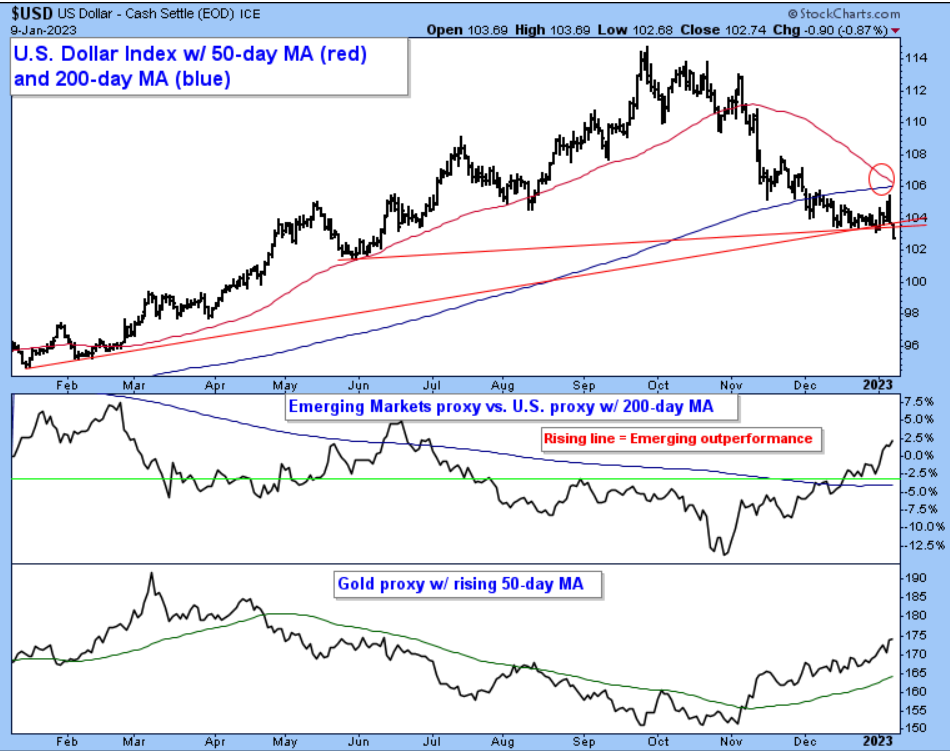
Figure 4: U.S. Dollar Index with 50-day MA (red) close to crossing below 200-day MA (blue). |Given the importance this plays in directional moves of several asset classes, important support levels are being violated. Again, I say, “Bounce now or forever hold your peace.”
Originally published 10 January, 2023.
For more news, information, and analysis, visit the ETF Strategist Channel.
Note: A lot of questions need to be answered as 2023 starts. Consequently, the Day Hagan/Ned Davis Research strategies may provide a complement to core investment strategies concerning domestic equity, international equity, and fixed income exposure. Please reach out for specifics and how we can support you in 2023.
Day Hagan Asset Management appreciates being part of your business, either through our research efforts or investment strategies. Please let us know how we can further support you.
Art Huprich, CMT®
Chief Market Technician
Day Hagan Asset Management
—Written 01.09.2023. Chart and table source: Stockcharts.com unless otherwise noted.
Upcoming Events
Day Hagan Technical Analysis, hosted by Art Huprich, CMT, on January 24, 2023, at 4:15 p.m. EDT
