

Catastrophic Stop Update
The NDR Catastrophic Stop Sell model combines time-tested, objective indicators designed to identify high-risk periods for the equity market. The model (Figure 1) deteriorated slightly from last month but entered September with a fully invested equity allocation recommendation.
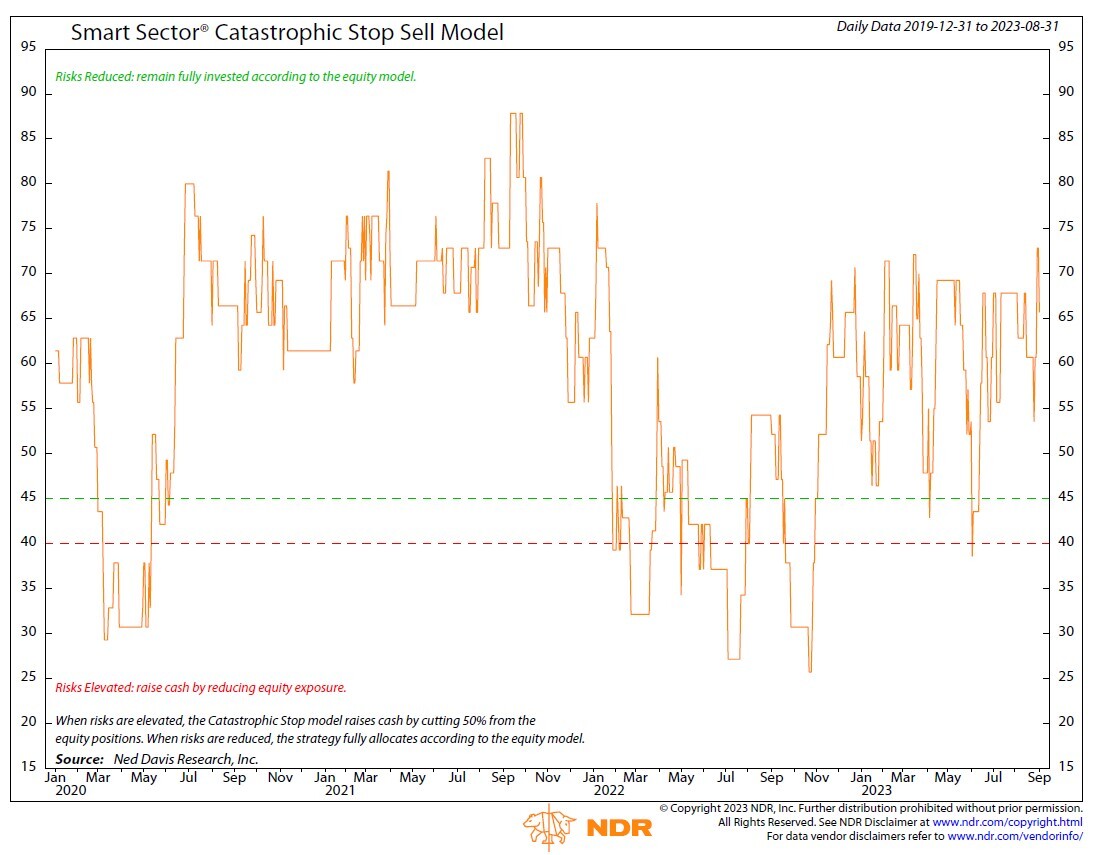
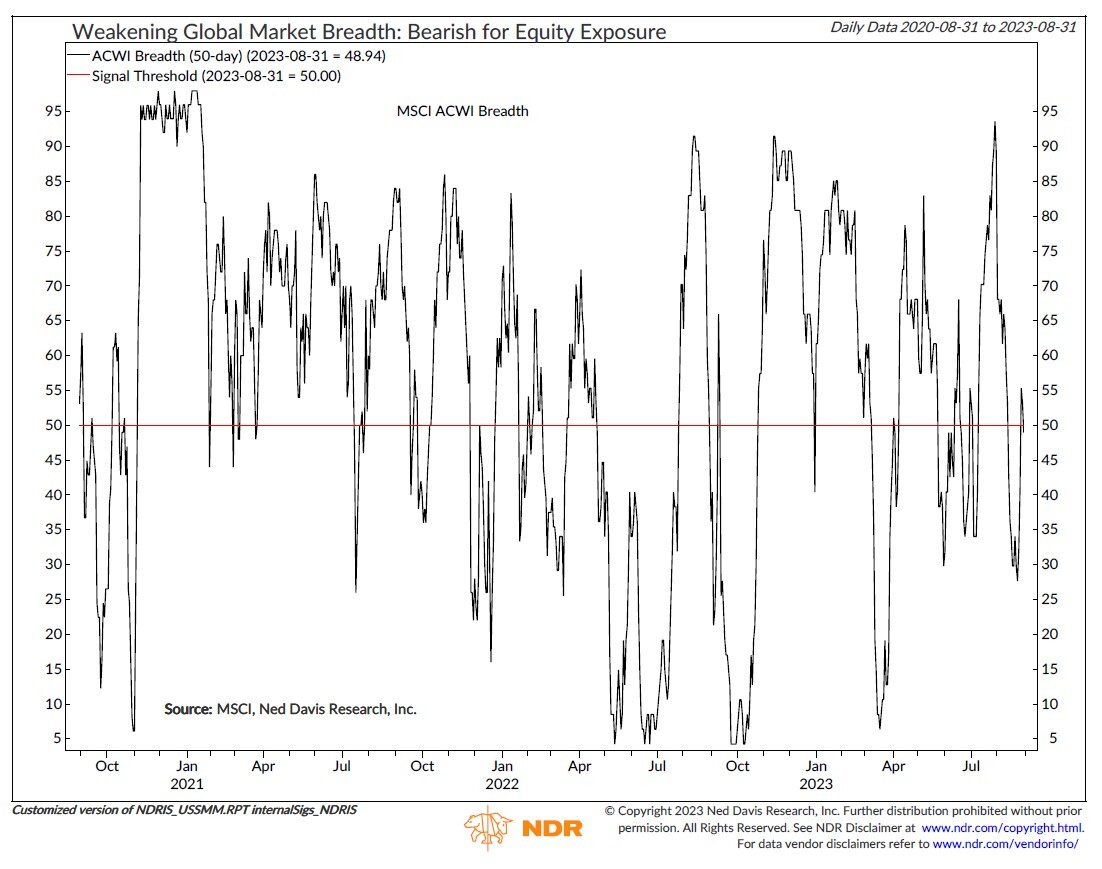
The model’s overall bullish position is driven by four of the seven (price-based) measures that remain positive for stocks. However, global market breadth weakened during the month and flashed a sell signal (Figure 2). While external influences such as trade and market sentiment remained bearish and neutral, respectively, they’re offset by bullish readings from high-yield and emerging market bond breadth, as well as high-yield option-adjusted spreads. For now, the weight of the evidence recommends a fully invested allocation to equity sectors according to the model.
Figure 2: Weakening Global Market Breadth: Bearish for Equity Exposure
U.S. Market Update
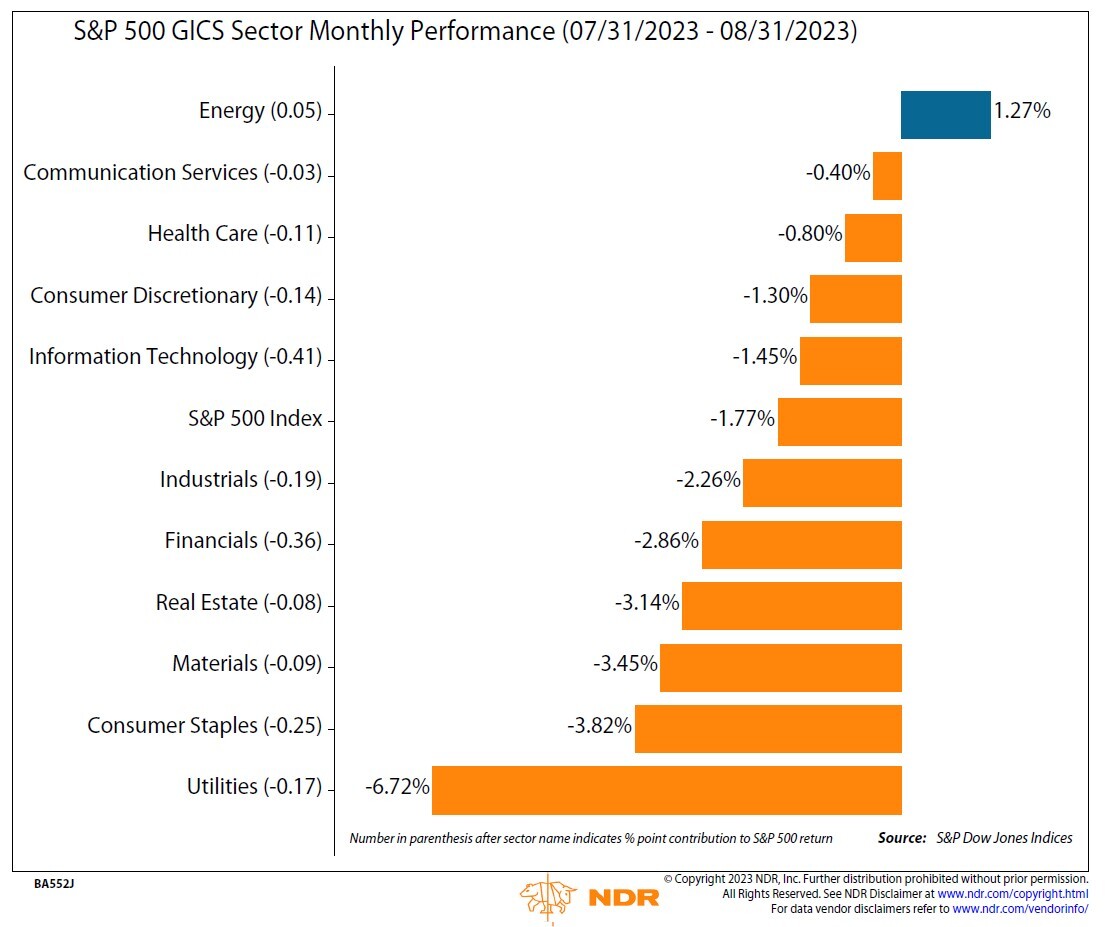
The S&P 500 Total Return Index declined about 1.6% in August, breaking its five-month winning streak. Breadth weakened sharply—10 of the 11 S&P 500 sectors posted negative returns in the month of August. Cyclical Value sectors such as Financials, Materials, and Industrials reversed course in August and underperformed the broad market. Only Energy had positive gains (Figure 3).
The spike in bond yields coincided with the pullback in the S&P 500 Total Return Index after a two-month surge of 10%. However, the jump in yields has not been violent enough to derail the stock market by historical standards. The risk of a policy mistake in late 2023 or early 2024 remains on the table.
The government stepped on the gas in 2023 with one of the most expansionary policy years not associated with a recession on record. For the stock market to be choppy into the first half of next year—like the four-year presidential cycle suggests—government policy needs to be less expansionary. The potential for higher-for-longer monetary policy, the restart of student loan payments, a government shutdown, and lower COLA adjustments in 2024 could combine for a less friendly policy for financial markets.
The sector model remained with a mix of cyclical and defensive leadership during the month. Entering September, the sector model is overweight Information Technology, Communication Services, and Utilities. Health Care, Industrials, and Financials moved to marketweight, while Consumer Discretionary, Consumer Staples, Materials, and Real Estate are underweight.
Figure 3: S&P 500 GICS Sector Monthly Performance (07/31/2023-08/31/2023)
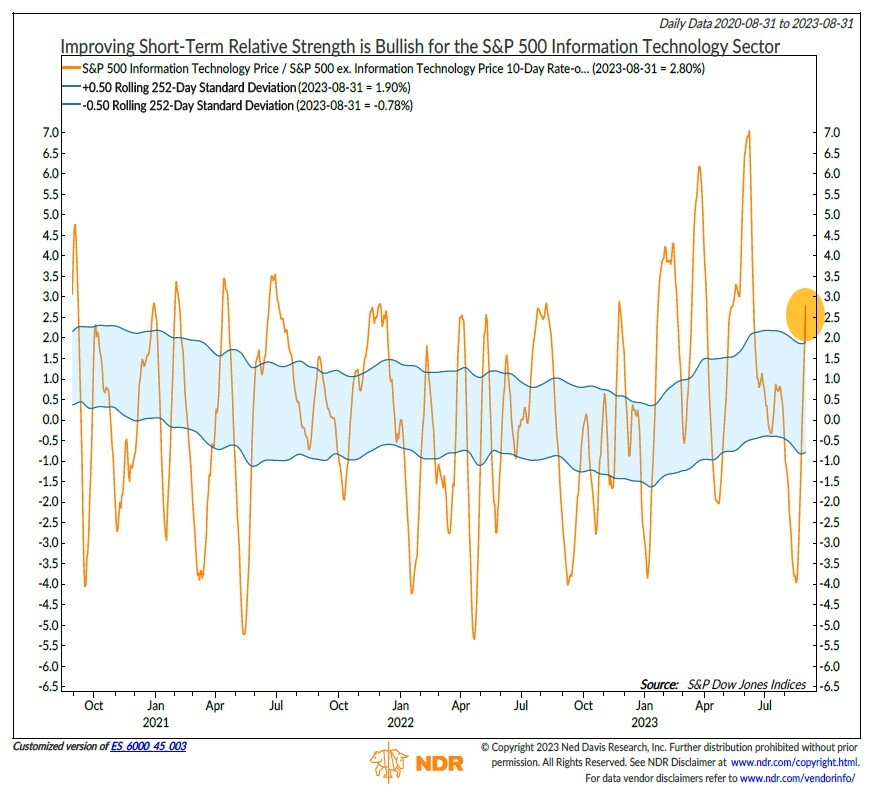
Allocation to the Information Technology sector rose in August, moving the sector to slightly overweight. Tech gains have moderated over the past three months and have been more in line with benchmark returns. While sales yield and inflation expectations remain bearish for the sector, there are now three indicators that are bullish—earnings revision breadth flashed a positive signal during the month, but it could get whipsawed. Four of the five internal (price-based) indicators are bullish—weakness in intermediate-term net new highs was offset by improving short-term relative strength (Figure 4).
Figure 4: Improving Short-Term Relative Strength is Bullish for the S&P 500 Information Technology Sector
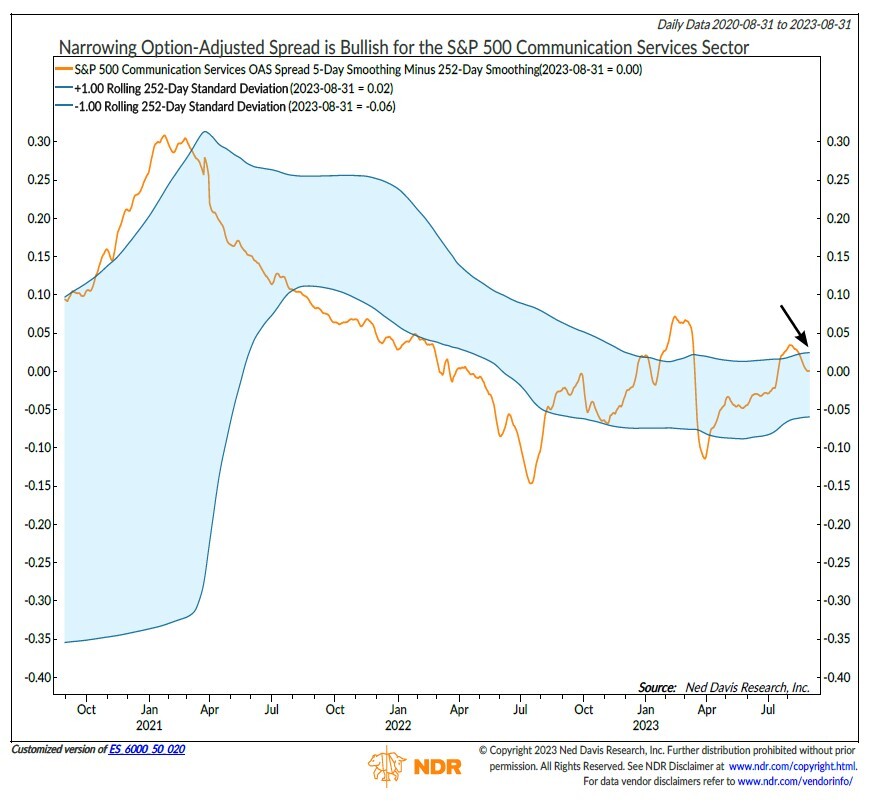
The Communication Services sector allocation increased and improved to overweight. On a fundamental basis, a narrowing option-adjusted spread (OAS) flashed bullish for the sector (Figure 5). Internal (price-based) indicators confirmed this, as five of six indicators are now bullish, with the latest signal coming from an overbought/oversold measure.
Figure 5: Narrowing Option-Adjusted Spread is Bullish for the S&P 500 Communication Services Sector
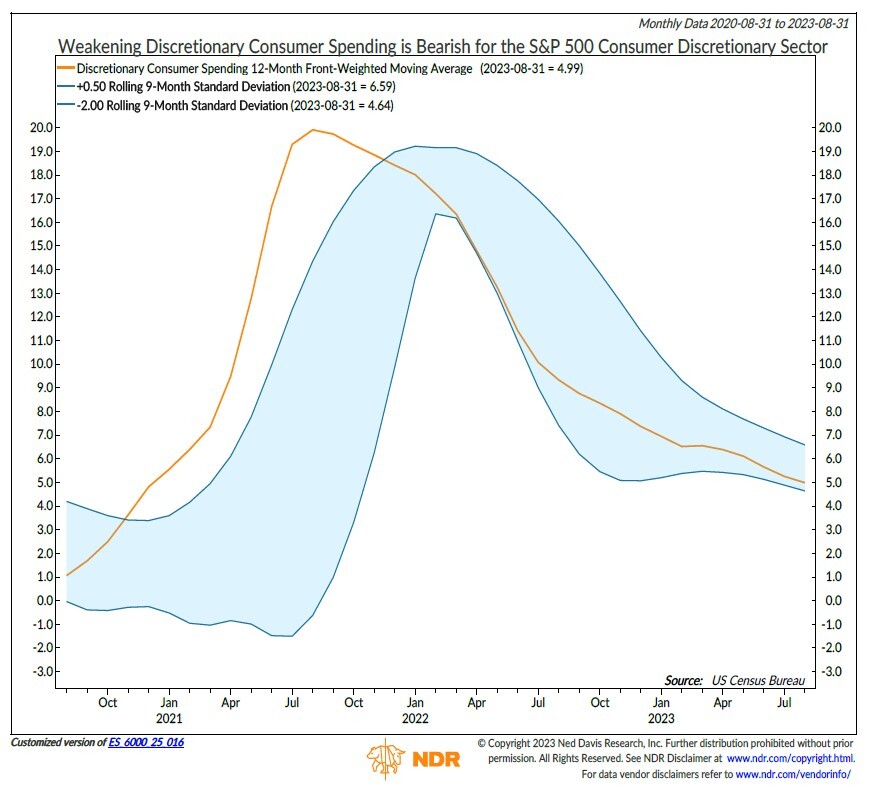
The Consumer Discretionary sector’s allocation decreased and was downgraded from overweight to an underweight position. On a fundamental basis, while housing starts improved to a bullish level, discretionary consumer spending continues to soften due to higher interest rates, which is bearish for the sector (Figure 6). This is confirmed by technicals—four measures moved bearish during the month.
Figure 6: Weakening Discretionary Consumer Spending is Bearish for the S&P 500 Consumer Discretionary Sector
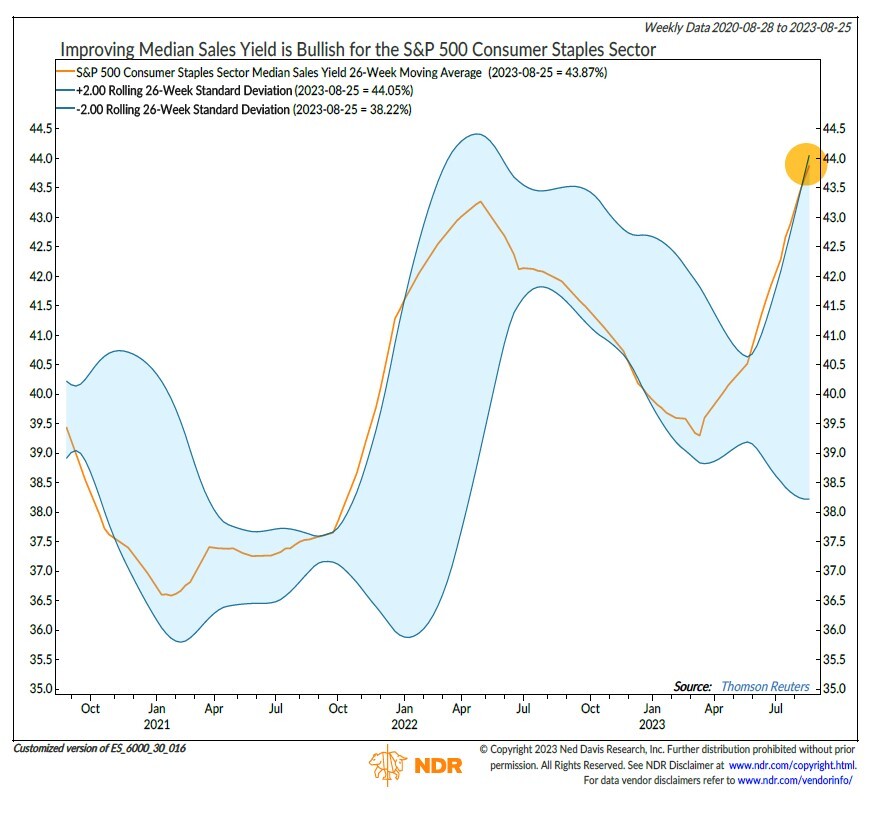
Consumer Staples’ allocation increased in August, but it remains an underweight position. It was the second worst-performing sector in August. On a fundamental basis, about half of the indicators are positive for the sector. Valuation (median sales yield, Figure 7) improved to a bullish level, joining credit conditions, consumer purchasing power, and economic surprises. However, most price-based measures remain bearish.
Figure 7: Improving Median Sales Yield is Bullish for the S&P 500 Consumer Staples Sector
Summary
Sector leadership remained mixed during the month. Entering September, the sector model is overweight Information Technology, Communication Services, and Utilities. Health Care, Industrials, and Financials moved to marketweight, while Consumer Discretionary, Consumer Staples, Materials, and Real Estate are underweight. The sector model uses sector-specific indicators to determine opportunities and identify risks in an objective, weight-of-the-evidence approach.
NDR Strategists contributing to this publication: Brian Sanborn, CFA, Ed Clissold, CFA, Rob Anderson, CFA, Thanh Nguyen, CFA, Tim Hayes, CMT, Joe Kalish
For more information, please contact us at:
Day Hagan Asset Management
1000 S. Tamiami Trl
Sarasota, FL 34236
Toll Free: (800) 594-7930
Office Phone: (941) 330-1702
Website: https://dayhagan.com/ or https://dhfunds.com/
Strategy Description
- The Smart Sector® with Catastrophic Stop strategy combines two Ned Davis Research quantitative investment strategies: The NDR Sector Allocation and the NDR Catastrophic Stop.
The process is based on the weight of the evidence
- The fund begins by overweighting and underweighting the S&P 500 sectors based on Ned Davis Research’s proprietary sector models.
- Each of the sector models utilizes sector-specific, weight-of-the-evidence composites of fundamental, economic, technical, and behavioral indicators to determine each sector’s probability of outperforming the S&P 500.
- Sectors are weighted relative to benchmark weightings.
When market risks become extraordinarily high — reduce your portfolio risk
- The model remains fully invested unless the Ned Davis Research Catastrophic Sell Stop (CSS) model is triggered, whereupon the equity-invested position is trimmed to 50%.
- The NDR Catastrophic Sell Stop model combines time-tested, objective indicators designed to identify periods of high risk for the broad U.S. equity market. The model uses price-based, breadth, deviation from trend, fundamental, economic, interest rate, behavioral and volatility-based indicator composites.
When market risks return to normal — put your money back to work
- When the NDR CSS model moves back to bullish levels, indicating lower risk, the strategy immediately moves back to fully invested.
For more information, please contact us at:
Day Hagan Asset Management
1000 S. Tamiami Trl
Sarasota, FL 34236
Toll Free: (800) 594-7930
Office Phone: (941) 330-1702
Website: https://dayhagan.com/ or https://dhfunds.com/
Ned Davis Research Disclaimer:
The data and analysis contained within are provided “as is” and without warranty of any kind, either express or implied. The information is based on data believed to be reliable, but it is not guaranteed. NDR DISCLAIMS ANY AND ALL EXPRESS OR IMPLIED WARRANTIES, INCLUDING, BUT NOT LIMITED TO, ANY WARRANTIES OF MERCHANTABILITY, SUITABILITY OR FITNESS FOR A PARTICULAR PURPOSE OR USE. All performance measures do not reflect tax consequences, execution, commissions, and other trading costs, and as such investors should consult their tax advisors before making investment decisions, as well as realize that the past performance and results of the model are not a guarantee of future results. The Smart Sector® Strategy is not intended to be the primary basis for investment decisions and the usage of the model does not address the suitability of any particular investment for any particular investor.
Using any graph, chart, formula, model, or other device to assist in deciding which securities to trade or when to trade them presents many difficulties and their effectiveness has significant limitations, including that prior patterns may not repeat themselves continuously or on any particular occasion. In addition, market participants using such devices can impact the market in a way that changes the effectiveness of such devices. NDR believes no individual graph, chart, formula, model, or other device should be used as the sole basis for any investment decision and suggests that all market participants consider differing viewpoints and use a weight of the evidence approach that fits their investment needs.
DISCLOSURES
Past performance does not guarantee future results. No current or prospective client should assume future performance of any specific investment or strategy will be profitable or equal to past performance levels. All investment strategies have the potential for profit or loss. Changes in investment strategies, contributions or withdrawals and economic conditions may materially alter the performance of your portfolio. Different types of investments involve varying degrees of risk, and there can be no assurance that any specific investment or strategy will be suitable or profitable for a client’s portfolio. Historical performance results for investment indexes and/or categories generally do not reflect the deduction of transaction and/or custodial charges or the deduction of an investment management fee, the incurrence of which would have the effect of decreasing historical performance results. There can be no assurances that a portfolio will match or outperform any particular benchmark.
Day Hagan Asset Management is registered as an investment adviser with the United States Securities and Exchange Commission. SEC registration does not constitute an endorsement of the firm by the Commission, nor does it indicate that the adviser has attained a particular level of skill or ability.
References to “NDR” throughout refer to Ned Davis Research, Inc. Clients engaging in this strategy will be advised by Day Hagan and will not have a contractual relationship with NDR. Day Hagan purchases signals from NDR, and Day Hagan is responsible for executing transactions on behalf of its clients and has discretion in how to implement the strategy.
NDR is a registered as an investment adviser with the Securities and Exchange Commission (SEC). NDR serves as the Signal Provider in connection with this strategy. The information provided here has not been approved or verified by the SEC or by any state or other authority. Additional information about NDR also is available on the SEC’s website at https://www.adviserinfo.sec.gov/. This material is provided for informational purposes only and is not intended as an offer or solicitation with respect to the purchase or sale of any security or other financial instrument or to participate in any trading strategy. NDR’s strategies, including the model discussed in this publication, are intended to be used only by sophisticated investment professionals.
There may be a potential tax implication with a rebalancing strategy. Re-balancing involves selling some positions and buying others, and this activity results in realized gains and losses for the positions that are sold. The performance calculations do not reflect the impact that paying taxes would have, and for taxable accounts, any taxable gains would reduce the performance on an after-tax basis. This reduction could be material to the overall performance of an actual trading account. NDR does not provide legal, tax or accounting advice. Please consult your tax advisor in connection with this material, before implementing such a strategy, and prior to any withdrawals that you make from your portfolio.
There is no guarantee that any investment strategy will achieve its objectives, generate dividends or avoid losses.
© 2023 Ned Davis Research, Inc. | © 2023 Day Hagan Asset Management, LLC
For more news, information, and analysis, visit the ETF Strategist Channel.