

Summary
In last Tuesday’s Chart Jamboree, we discussed how the domestic equity market indices were closer to resistance than support. Don’t be surprised by some type of short-term pause/pullback. Following last week’s tape action, I am still of that short-term opinion.
4600 Target Achieved and…
*** Next Tech Talk report mid-August ***
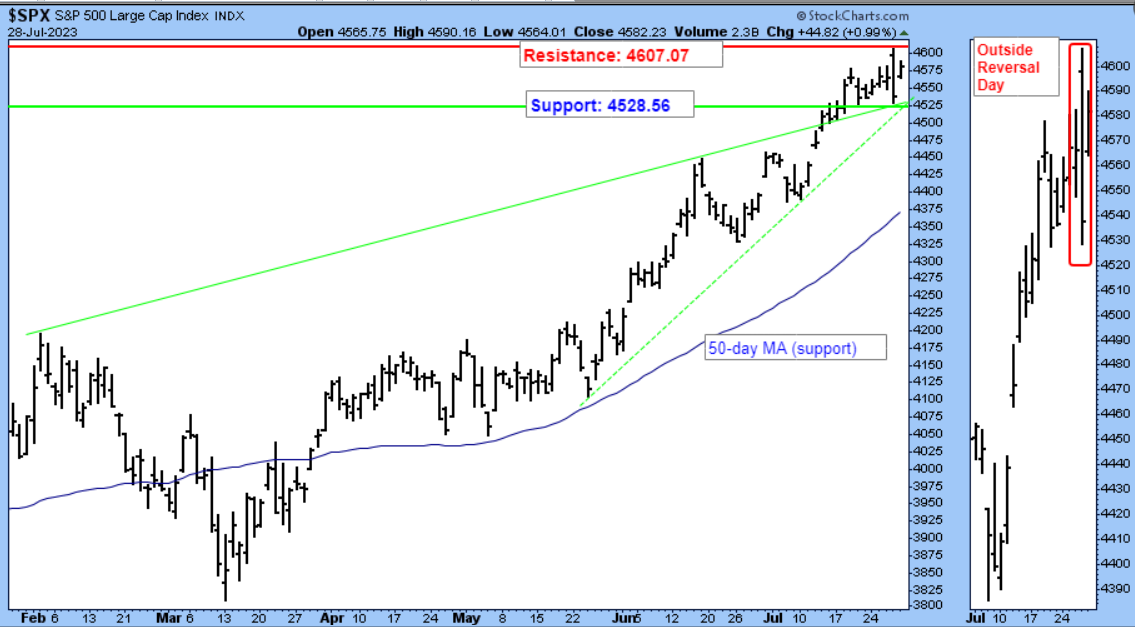
Shortly after the S&P 500 decisively broke out above 4195 to 4220 resistance, we discussed, more than once, a price target of about 4600. The target was derived by measuring the depth of the completed base. The SPX tagged 4607 last Thursday (7.27.23) and promptly reversed sharply from up to down the same day. In doing so, a potential bearish, short-term “Outside Reversal Day” was recorded.
An Outside Reversal Day is a two-day chart pattern that can indicate a reversal in trend. The second day’s high must be above the previous day’s high, while the low must be below the previous day’s low. In addition, the second day must close in the opposite direction of the previous trend—in an uptrend, the second day must close down. Figure 1, page two.
Before looking at the chart, please note two key points: “potential” and “short-term.” The short-term uptrend for the SPX has not yet changed. There is a potential change. We need confirmation (downside follow-through) to discern a change in short-term trend from up to sideways/down. Also, regardless of the short-term trend, the primary trend for the SPX, as dictated by the NDR Catastrophic Stop Loss Model, remains supportive for now.
Speaking of the NDR Catastrophic Stop Loss Model, one of the portfolio managers of our Smart Sector strategies sends me an update on the model every Monday. Please let me know if you want to see it.
Figure 1: S&P 500 – 6-month & thumbnail chart to discern Outside Reversal Day. | One day’s price action doesn’t change the trend. Confirmation (a decisive close below support—green lines) is necessary for the short-term trend to change. And if last Thursday’s intraday high of 4607.07 is violated on a closing basis (red horizontal line), the pattern becomes null and void and the short-term uptrend will remain in force.
Bearish to Bullish: Gasoline
“While the soft-landing bandwagon continued to rumble forward,” said a member of JPM’s Economic and Policy Research team, the FOMC hiked 25bps last week and predicated the September decision on inter-meeting data. Interestingly, future decisions will hinge on multiple CPI, PPI, and employment reports between now and then. “At several points Powell noted that rates are already restrictive and will continue to slow the economy, and that even if they didn’t raise rates further, they would likely keep them elevated for some time,” emphasis mine. One area that investors/traders should monitor closely is energy, specifically Gasoline. Figure 2.
Figure 2: Gasoline with rising 200-day MA & positive momentum. | Richard Russell said, “The fact is that significant market trends develop over a period of months, not days.” No truer words, as shown below.

Please let me know if you would like to schedule a call to go over the process and discipline underpinning our Smart Sector with Catastrophic Stop, Smart Sector International, and/or Smart Sector Fixed Income strategies.
Day Hagan Asset Management appreciates being part of your business, either through our research efforts or investment strategies. Please let us know how we can further support you.
Art Huprich, CMT®
Chief Market Technician
Day Hagan Asset Management
—Written 07.30.2023. Chart Source: Stockcharts.com unless otherwise noted.
Upcoming Events
Day Hagan Technical Analysis, hosted by Art Huprich, CMT, on September 12, 2023, at 4:15 p.m. EDT
For more news, information, and analysis, visit the ETF Strategist Channel.