By Richard Bernstein, Richard Bernstein Advisors
China’s stock market was one of the worst performers during 2018. The combination of a trade war and slowing global growth was not a good one for such an export dependent economy. However, the weakness in external demand for Chinese goods led the government to stimulate the domestic economy with significant monetary and fiscal programs. In fact, China is the only major economy that is attempting to incrementally stimulate their economy.
One of the reasons we were so bullish on the US economy earlier in the decade was our belief that monetary and fiscal stimulus would work. Many pundits suggested the US economy would have an “L” shaped recovery, meaning that the economy would basically never recover from the “Great Recession”, and that the business cycle was effectively dead. The US economy did, of course, recover and there was a significant bull market.
There are similarly negative statements made today regarding the future of the Chinese economy, and how their monetary and fiscal efforts will prove impotent.
Chart 1 shows that there may be hope for the Chinese economy because of those stimulative measures. The chart compares the OECD Leading Economic Indicator for China versus that of the US, and the two indicators have been moving in opposite directions. Whereas the US indicator (green line) is increasingly suggesting an economic slowdown, the Chinese indicator (blue line) is beginning to improve. The China Leading Indicator’s recent improvement is quite unique. Chart 2 highlights that China is one of only two major economies with improving leading economic indicators (Australia is the other).
Admittedly, Chinese corporate profits have yet to improve, but evidence is starting to build that they might accelerate in 2019. China is our primary overweight outside the US.
CHART 1:
China vs. US: OECD Leading Indicators
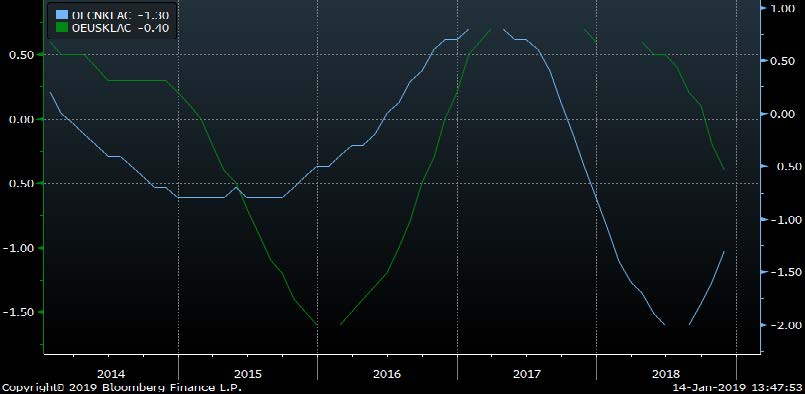
Source: Richard Bernstein Advisors LLC, OECD, Bloomberg Finance L.P.
CHART 2:
LEI Momentum
Based on 1/14/19 OECD Release
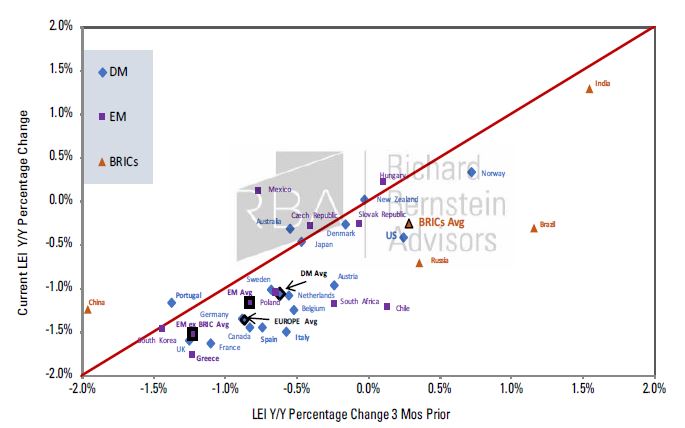
Source: Richard Bernstein Advisors LLC, OECD
Stable growth may be more important than Value vs. Growth
Consensus seems to favor value stocks over growth stocks for 2019, but that dichotomy may be the wrong way to frame the issue. Rather than value versus growth, we think a better comparison is stable growth versus cyclical growth.
Value traditionally outperformed growth when profits cycles accelerated because value stocks historically tend to be more cyclical than are growth stocks. However, growth outperformed value during 2018 as the profits cycle accelerated largely because growth stocks were more cyclical than value stocks. Chart 3 points out that growth stocks within the S&P 500® outperformed value stocks by about 900 basis points during 2018.
Chart 4 includes our forecast for S&P 500® reported earnings growth for 2019, and we expect the profits cycle to slow as the year progresses. We do not anticipate a full-blown profits recession, but we see profits growth slowing from roughly 25% in 4Q18 to roughly 5-7% in 4Q19. Historically that would argue growth might outperform.
The problem with the traditional growth and value comparison is that both market segments are currently comprised of cyclical stocks. Chart 5 shows that value universes are presently dominated by financials, whereas growth universes are dominated by technology. The earning streams of both financials and technology are highly cyclical, so the argument today regarding growth versus value is simply one of cyclicals versus cyclicals.
CHART 3:
S&P 500® Growth vs. Value 2018 Performance
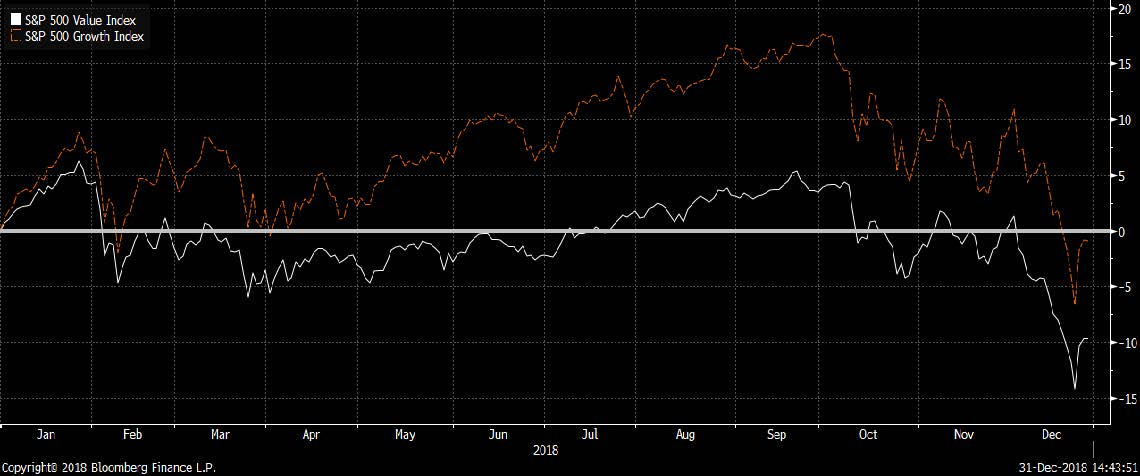
Source: Richard Bernstein Advisors LLC, Bloomberg Finance L.P.
CHART 4:
S&P 500® Reported Y/Y Trailing GAAP EPS Growth from Dec. 1980 -Sep. 2018
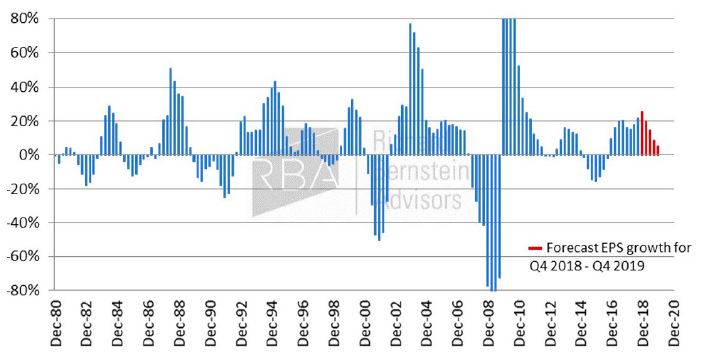
Source: Richard Bernstein Advisors LLC, Standard & Poor’s
CHART 5:
Relative Sector Weights:
S&P 500® Value Index vs. S&P 500® Growth Index

Source: Bloomberg Finance L.P.
Stable growth is typically a critical characteristic when profits cycles decelerate. After all, cycles are determined by cyclicals, and if the profits cycle is indeed going to decelerate in 2019, then accordingly one should underweight cyclicals and overweight stable growth.
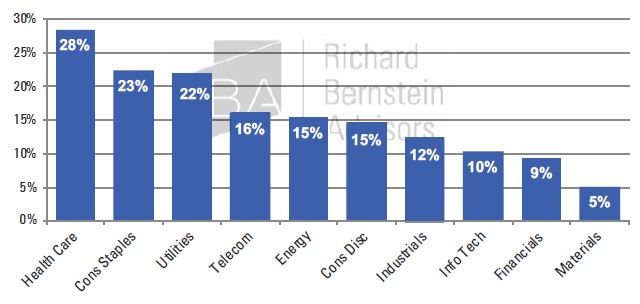
Overweighting stable growth has been considerably more important when the profits cycle decelerated than has worrying about growth or value. Chart 6 shows the performance of S&P 500® sectors when the profits cycle decelerates. Technology and Financials have historically been the
2nd and 3rd worst performing sectors when profits decelerated.
CHART 6:
Average Performance when Profits Decelerate: S&P 500® Sectors
(Sep. 1989 – Dec. 2015*)