

Why we believe the Yield Curve suggests continued economic growth
By Doug Sandler, Chris Konstantinos & Rod Smyth, RiverFront Investment Group
Even Gradually Rising Rates are Tough for Bond Markets. At RiverFront, we have a consistent message about bonds, which is that yield matters. We believe starting yields will be the primary determinant of bond returns in both rising and falling interest rate environments. Five years ago, at the end of the first quarter of 2013, the 10-year Treasury note was yielding 1.7% and the Barclays Aggregate US bond index (known as “the AGG”) has returned 1.8% in the subsequent five years through the end of the first quarter. The comparable numbers for the 10 years through Q1 are 3.4% and 3.6% respectively. Past performance is no guarantee of future results.
The good news is that the returns of the benchmark bond index are positive, the bad news is the opportunity cost. Global stocks as represented by the MSCI World Index have risen 9.2% per year in the last 5 years and 5.6% a year for the last 10 years. Today the yield on the 10-year Treasury note is approaching 3% and so we think investors should expect positive returns from the AGG in the next five and 10 years. That said, returns for 2018 may continue to be negative if, as we expect, the federal reserve continues to raise interest rates and 10-year bond yields rise to the upper end of our 2.5% to 4% range. We continue to believe that global stocks are priced to deliver 5-10% returns over the next five to ten years, making them a compelling part of portfolios where the owner can tolerate the extra volatility.
What is the Yield Curve, and why has it predicted recessions in the past? In our opinion, the greatest risk to stocks in the next year or so is a recession that causes a decline in sales, profits and profit margins. Most economic indicators we follow suggest that the global economic expansion, which reaccelerated from the middle of 2016, will continue in 2018 and 2019. That said, there has been a lot of focus this year on the yield curve which some think is flashing a warning sign. We disagree.
The yield curve is the relationship between shorter and longer-term interest rates. A line drawn through the different interest rate maturities, from the Fed Funds overnight rate to 30-year bond yields is rarely a straight line and so often resembles a curve. Most of the time, short-term interest rates are lower than long-term interest rates. Investors receive a premium for having their rates fixed for longer periods of time. However, when bond investors feel like the Federal reserve has raised interest rates too high, and that a recession is imminent, long-term rates can fall below short-term ones “inverting” the shape of the curve.
As it turns out, bond investors have been fairly good predictors of recessions as our Weekly Chart on page 2 shows. In the chart, we show the difference between 2-year yields and 10-year yields – the 10/2 yield curve spread (upper line, RH scale) and 2-year Treasury yields (the dark blue lower line, values on the LH scale). We (along with many investors) use 2-year yields because they are a good guide of market expectations about the path of short-term interest rates. In the graph, recessions are denoted by the grey shaded areas. Most of the time during the last 40 years, the spread has been above the zero-line shown on the left-hand scale, meaning that 10-year interest rates have been above 2-year interest rates. However, preceding each recession, the upper line has dipped below zero as 10-year yields have fallen below 2-year yields (see ovals).
![]()
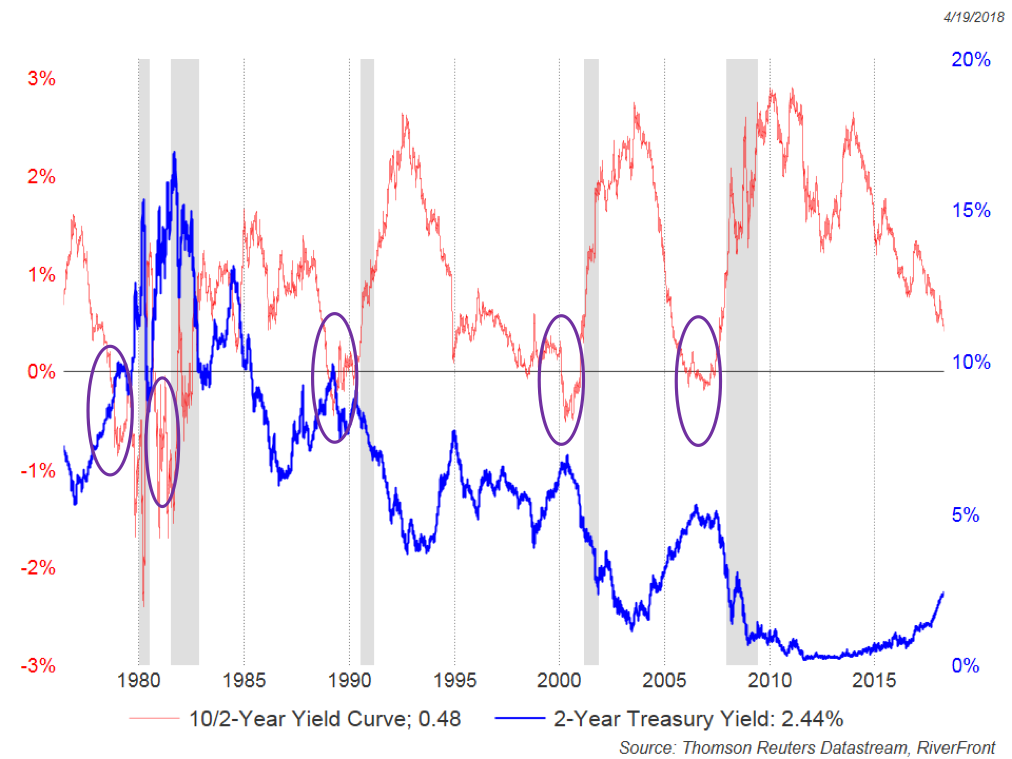
Source: Thomson Reuters Datastream, RiverFront. Past performance is no guarantee of future results. Shown as illustrative purposes and not indented as a recommendation.
As you can see, the yield curve (upper line) has fallen since 2-year interest rates bottomed in 2012. Now that short-term interest rates are rising strongly, yield curve watchers are on high alert. The reason we are less concerned is that the current level of the spread is quite normal for a mature expansion (it remained below current levels from 1995 to 2000). Furthermore, the fed’s stated goal is to normalize interest rates, not to risk a recession. We expect 10-year interest rates to rise from current levels, maintaining a positive spread. Finally, this indicator has usually given at least a year’s warning of a recession. We will re-assess the risk of recession if the spread goes negative, but our belief is that it will not do so in 2018.
Conclusion: While we do not believe rising rates and a flattening yield curve will be a near-term risk to stocks, we do view them as a risk to fixed income positions. As a result, our fixed income positioning favors floating-rate and high yield bank loans at the short-end of the curve, investment grade corporates at the short and intermediate portion, and Treasuries at the long-end. Our portfolios are roughly one-year short duration compared to their benchmarks.
Doug Sandler, CFA, is Global Strategist; Chris Konstantinos, CFA, is Chief Investment Strategist; and Rod Smyth is Director of Investments at RiverFront Investment Group, a participant in the ETF Strategist Channel.
Important Disclosure Information
The comments above refer generally to financial markets and not RiverFront portfolios or any related performance. Past results are no guarantee of future results and no representation is made that a client will or is likely to achieve positive returns, avoid losses, or experience returns similar to those shown or experienced in the past.
Information or data shown or used in this material is for illustrative purposes only and was received from sources believed to be reliable, but accuracy is not guaranteed.
RiverFront Investment Group, LLC, is an investment adviser registered with the Securities Exchange Commission under the Investment Advisers Act of 1940. The company manages a variety of portfolios utilizing stocks, bonds, and exchange-traded funds (ETFs). RiverFront also serves as sub-advisor to a series of mutual funds and ETFs. Opinions expressed are current as of the date shown and are subject to change. They are not intended as investment recommendations.