
By Roman Chuyan, CFA, Model Capital Management
- Economists are competing for the gloomiest projection, with some expecting a -25% GDP in Q2.
- Our Credit model gave a Buy signal, and we shifted from T-Bills to corporate loans and bonds.
Please bookmark our ETF Strategist page for the latest articles!
Financial markets continue to march to the drumbeat of news about the coronavirus pandemic. Its exponential spread has taken a heavy toll in both human life and economic activity. As testing becomes more available, known infections have risen sharply and the US jumped to first place globally in total infections. New York City emerged as the new epicenter of the disease, and multiple states have closed non-essential businesses. In addition to the halt in all travel, entertainment, and public events, the entire manufacturing and retail industries were shuttered in several states, forcing employers to furlough millions of employees.
After protecting our clients against this downturn, we continue to be defensive in our tactical strategies. Our Credit model turned positive after bond prices fell in March (see Fixed Income section), and we bought investment-grade bonds and loans.
Years of over-investment in risk assets – stocks, bonds, asset-backed, high-yield – had to be unwound as the downturn began. Many investors trying to sell at the same time made the selloff especially steep earlier in March, resembling closely the steep selloff in October of 2008. The 2008 episode wasn’t the end of that bear market, and this might not be the end of current one. Bear markets last for awhile, and ultimately result in a significant destruction of wealth: the S&P 500 dropped by at least 47% in the past two bear markets.
Economic Focus
Just two weeks ago, I think most of us expected a mild-to-moderate economic downturn because of virus-containment measures. In my previous report, I wrote that major banks would project a recession. It turned out to be a contest for the gloomiest projection. Many economists now expect around a 10% annualized contraction in Q1 and 25% in Q2. Goldman Sachs is winning the contest, announcing on March 31st that it expects the US economy to shrink by an annualized 34% in Q2 and unemployment to soar to 15%. If anything close to that occurs, it would be the largest economic downturn since 1946 when GDP fell by 11.6% as the manufacturing of war materiel ended. The deepest recent quarterly downturns occurred in 2008 (-8.4% annualized), and before that in 1958 (-10%).
Economic numbers for March are only beginning to come in, with initial jobless claims soaring to 3.3 million last week – by far the largest weekly job loss on record. We’re in uncharted territory.
Initial Jobless Claims
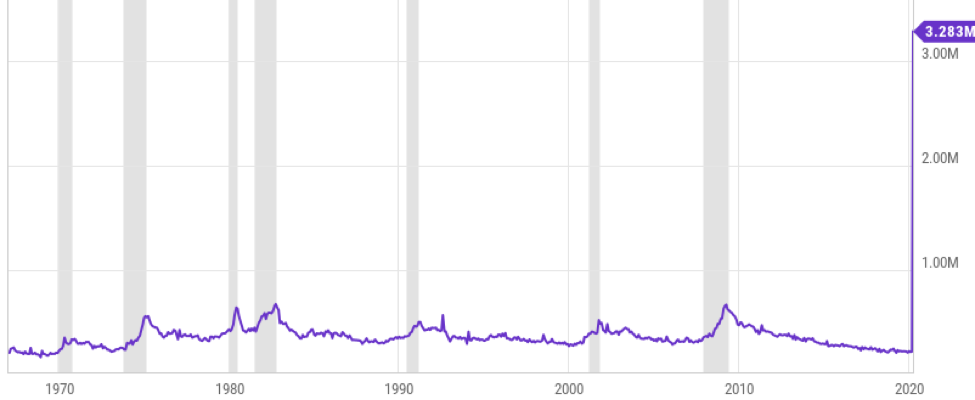
Source: Ycharts
Some media reports are beginning to point to “warning signs” that appeared before the pandemic began of a fragile economy, high stock valuation, and excessive borrowing. Of course, these signs were obvious to anyone who cared to look. We wrote about them for most of last year and were defensive based on our models, which protected our clients against this downturn. But the economists at major banks and securities firms were too busy cheerleading the rising market. There should be no surprise, however – economists follow markets.
Fixed Income
We have just experienced a bear-market adjustment in bonds. Corporate and high-yield bond prices began to fall sharply in mid-March along with other risk assets, as years of overinvestment started to be corrected. Credit spreads widened: the investment-grade to 400 basis points (from 100 bps previously) and high-yield to 10.9% (from 3.5%), their widest since 2009. Around the same time, the Fed launched massive stimulus efforts, including zero rates and quantitative easing. In response, Treasuries rallied, but not corporate or high-yield bonds as risk aversion persisted.
Credit ETF Prices, 3 Years

Source: Ycharts
The Fed then launched on March 23rd an unprecedented program of buying, through the US Treasury, bonds and bond ETFs. The Fed has never done this before, although the Bank of Japan has been buying bonds (and equities) since 2008. This program eased liquidity concerns and credit spreads began to come back down: corporate to 300 bps and high-yield to 8.8% (see chart below). Although volatility might resume in the short term, given the Fed/Treasury unlimited buying power, this virtually insures against further significant declines in bond prices/rise in their spreads.
Credit Spreads, 2007-2020

Source: Ycharts
We rely on our fixed-income models for bond allocations. Our Duration and TIPS models continue to be negative due to extremely low Treasury/TIPS yields (see chart). However, our Credit model now gives a Buy signal as corporate spread jumped above 300 bps:

Source: Model Capital Management LLC
About Model Capital Management LLC
Model Capital Management LLC (“MCM”) is an independent SEC-registered investment advisor, and is based in Wellesley, Massachusetts. Utilizing its fundamental, forward-looking approach to asset allocation, MCM provides asset management services that help other advisors implement its dynamic investment strategies designed to reduce significant downside risk. MCM is available to advisors on AssetMark, Envestnet, and other SMA/UMA platforms, but is not affiliated with those firms.
Notices and Disclosures
- This research document and all of the information contained in it (“MCM Research”) is the property of MCM. The Information set out in this communication is subject to copyright and may not be reproduced or disseminated, in whole or in part, without the express written permission of MCM. The trademarks and service marks contained in this document are the property of their respective owners. Third-party data providers make no warranties or representations relating to the accuracy, completeness, or timeliness of the data they provide and shall not have liability for any damages relating to such data.
- MCM does not provide individually tailored investment advice. MCM Research has been prepared without regard to the circumstances and objectives of those who receive it. MCM recommends that investors independently evaluate particular investments and strategies, and encourages investors to seek the advice of an investment adviser. The appropriateness of an investment or strategy will depend on an investor’s circumstances and objectives. The securities, instruments, or strategies discussed in MCM Research may not be suitable for all investors, and certain investors may not be eligible to purchase or participate in some or all of them. The value of and income from your investments may vary because of changes in securities/instruments prices, market indexes, or other factors. Past performance is not a guarantee of future performance, and not necessarily a guide to future performance. Estimates of future performance are based on assumptions that may not be realized.
- MCM Research is not an offer to buy or sell or the solicitation of an offer to buy or sell any security/instrument or to participate in any particular trading strategy. MCM does not analyze, follow, research or recommend individual companies or their securities. Employees of MCM may have investments in securities/instruments or derivatives of securities/instruments based on broad market indices included in MCM Research.
- MCM is not acting as a municipal advisor and the opinions or views contained in MCM Research are not intended to be, and do not constitute, advice within the meaning of Section 975 of the Dodd-Frank Wall Street Reform and Consumer Protection Act.
- MCM Research is based on public information. MCM makes every effort to use reliable, comprehensive information, but we make no representation that it is accurate or complete. We have no obligation to tell you when opinions or information in MCM Research change.
- MCM DOES NOT MAKE ANY EXPRESS OR IMPLIED WARRANTIES OR REPRESENTATIONS WITH RESPECT TO THIS MCM RESEARCH (OR THE RESULTS TO BE OBTAINED BY THE USE THEREOF), AND TO THE MAXIMUM EXTENT PERMITTED BY LAW, MCM HEREBY EXPRESSLY DISCLAIMS ALL WARRANTIES (INCLUDING, WITHOUT LIMITATION, ANY IMPLIED WARRANTIES OF ORIGINALITY, ACCURACY, TIMELINESS, NON-INFRINGEMENT, COMPLETENESS, MERCHANTABILITY AND/OR FITNESS FOR A PARTICULAR PURPOSE).
- “Model Return Forecast” for 6-month S&P 500 return is MCM’s measure of attractiveness of the U.S. equity market obtained by applying MCM’s proprietary statistical algorithm and historical data, but is not promissory, and, by itself, does not constitute an investment recommendation. Model Return Forecasts were calculated and applied by MCM to its research and investment process in real time beginning from 2012. For periods prior to Jan 2012, the results are “back-tested,” i.e., obtained by retroactively applying MCM’s algorithm and historical data available in Jan 2012 or thereafter. Source for the S&P 500 actual returns: S&P Dow Jones.
- Index returns referenced in MCM Research, if any, are gross of any advisory fees, fund management fees, and trading expenses. Fund or ETF returns referenced, if any, are gross of advisory fees and trading expenses. Returns will be reduced by fees and expenses incurred.
