

The Inverted Yield Curve and Other Recession Indicators
The third quarter of 2019 was full of noise and lacking substance. There was a terrorist attack on oil facilities in Saudi Arabia, which affected the price of oil for about two weeks, and now oil is right back where it started. The U.S. dollar continued to grind higher and has now appreciated ~12.6% since its 2/16/2018 low. Manufacturing and trade continued to wane as the trade war drags on. The S&P 500® Index, NASDAQ and Dow Jones Industrial Average (DJIA) were each up about 1% while small caps continued to lag. Gold went up ~10% and then gave half back. Central Banks around the globe continued lowering interest rates in the latest easing cycle like the many we have seen over the last ten years. Brexit languishes on….
We’ve covered these topics ad nauseum over the past year in our blogs and quarterly commentaries, as have many other market commentators and strategists. Therefore, to avoid repetition, we’ll largely refrain from rehashing our ongoing concerns and instead focus on new developments. In our opinion, there was one major newsworthy event this quarter: the inversion of the yield curve.
 Historically, when the yield of the 10-year Treasury Bond has fallen below that of the 3-month Treasury Bill—a yield curve inversion—a recession has followed. From the beginning of 1969, up until the most recent recession which started in December of 2007, an inversion of the yield curve preceded all seven recessions. The yield curve first briefly inverted at the end of the first quarter of 2019. It inverted for a second time in May and has remained inverted since. At one point, as long rates plummeted during the third quarter, the yield of the 3-month Treasury Bill was 57 basis points higher than that of the 10-year Treasury Bond. While a yield curve inversion has been a solid indicator of a recession, it is imprecise at best. Historically, the time until a recession has varied between 5 and 16 months.
It is always possible that the future will be different from the past. We view the yield curve inversion as a blinking yellow light: it’s not necessary to stop but you should proceed with caution. In accordance with this, we’re watching other recession indicators to determine if the blinking yellow light may turn red.
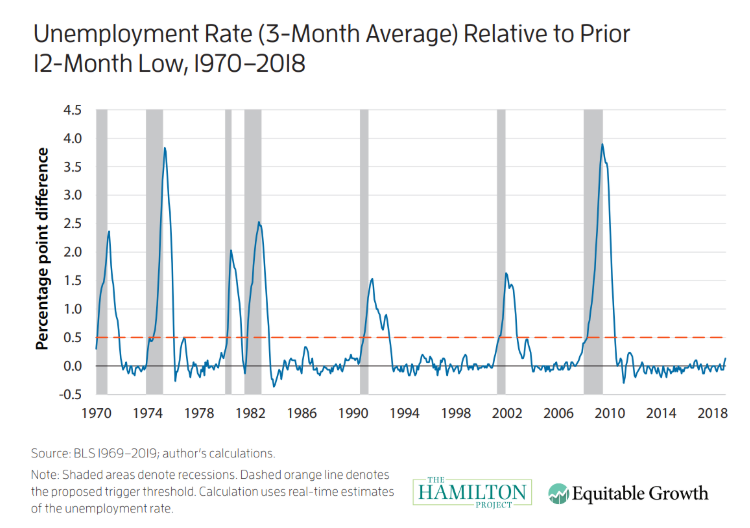
One datapoint that we watch closely for confirmation is unemployment claims. Claudia Sahm—the Section Chief for the Consumer and Community Research section in the Division of Consumer and Community Affairs at the Federal Reserve Board—recently codified this into a helpful rule, appropriately named “The Sahm Rule,” to trigger policy response at the onset of a recession. The rule’s “trigger” occurs when the 3-month average unemployment rate rises 50 basis points above its lowest point over the previous year. We intend to watch this indicator, and others like it, very closely.
Whether or not a recession occurs will likely determine the direction of the market over the next five years, but what about over a shorter time horizon? We believe the overriding question in the markets is the trade war, which coincidentally may be a large factor in whether or not the domestic and/or global economies enter a recession. Deal or no deal? The markets have become accustomed to the constant news flow, often contradictory, that comes out almost daily. Trade talk/rumors/tweets have become more of a Hasbro concoction than anything else…except it is not a game.
Globally, manufacturing (as measured by the Purchasing Managers Indices) continues to contract and all five of the world’s largest economies are in a manufacturing contraction. In the World Trade Organization’s (WTO) October update, the organization reduced its 2019 world trade growth forecast from 2.6% to 1.2%, stating “risks to the forecast are heavily weighted to the downside and dominated by trade policy”. The Director-General of the WTO, Roberto Azevêdo, summarized the situation perfectly:
“The darkening outlook for trade is discouraging but not unexpected. Beyond their direct effects, trade conflicts heighten uncertainty, which is leading some businesses to delay the productivity-enhancing investments that are essential to raising living standards”
A trade truce will do little good unless a significant portion of the current tariffs are removed, and all proposed and future tariffs are shelved. It is worth remembering that the last time tariffs were used in this fashion during the 1930’s, the Smoot-Hawley tariffs helped crater world trade by 2/3rds in just 5 or 6 years! Let’s hope this does not reoccur while at the same time recognizing the gravity of the situation.
For the sake of all economic participants we hope that the current economic expansion continues ad infinitum, but as realists we know that trees do not grow to the sky. The future will bring good times and bad. We have relied on our quantitative systems to navigate a variety of market conditions in the past, and we will continue to do so in the future.
This article was contributed by Dave Haviland, Portfolio Manager at Beaumont Capital Management, a participant in the ETF Strategist Channel.
For more insights like these, visit BCM’s blog at blog.investbcm.com
Disclosures:
Copyright © 2019 Beaumont Financial Partners, LLC. All rights reserved. All materials appearing in this commentary are protected by copyright as a collective work or compilation under U.S. copyright laws and are the property of Beaumont Capital Management. You may not copy, reproduce, publish, use, create derivative works, transmit, sell or in any way exploit any content, in whole or in part, in this commentary without express permission from Beaumont Capital Management.
Past performance is no guarantee of future results. Index performance is shown on a gross basis and an investment cannot be made directly in an index. The performance of any ETFs, as contributors or detractors to the strategy, are provided on a gross basis. An Exchange Traded Fund (ETF) is a security that tracks an index, a commodity or a basket of assets like an index fund, but trades like a stock on an exchange. ETFs experience price changes throughout the day as they are bought and sold. All BCM strategies invest only in long-only ETFs.
This material is provided for informational purposes only and does not in any sense constitute a solicitation or offer for the purchase or sale of a specific security or other investment options, nor does it constitute investment advice for any person. The material may contain forward or backward-looking statements regarding intent, beliefs regarding current or past expectations. The views expressed are also subject to change based on market and other conditions. The information presented in this report is based on data obtained from third party sources. Although it is believed to be accurate, no representation or warranty is made as to its accuracy or completeness.
As with all investments, there are associated inherent risks including loss of principal. Stock markets, especially foreign markets, are volatile and can decline significantly in response to adverse issuer, political, regulatory, market, or economic developments. Sector and factor investments concentrate in a particular industry, and the investments’ performance could depend heavily on the performance of that industry and be more volatile than the performance of less concentrated investment options and the market as a whole. Securities of companies with smaller market capitalizations tend to be more volatile and less liquid than larger company stocks. Foreign markets, particularly emerging markets, can be more volatile than U.S. markets due to increased political, regulatory, social or economic uncertainties. Fixed Income investments have exposure to credit, interest rate, market, and inflation risk.
Diversification does not ensure a profit or guarantee against a loss.
The Standard & Poor’s (S&P) 500® Index is an unmanaged index that tracks the performance of 500 widely held, large-capitalization U.S. stocks. Indices are not managed and do not incur fees or expenses. The S&P Small Cap 600® Index is an unmanaged index that tracks the performance of 600 widely held, small-capitalization U.S. stocks. The MSCI World Index is a free float-adjusted market capitalization weighted index that is designed to measure the equity market performance of developed markets. The MSCI World ex-U.S. Index is a free float-adjusted market capitalization weighted index that is designed to measure the equity market performance of developed markets, excluding the United States. The MSCI ACWI Index captures large and mid-cap representation across 23 Developed Markets and 26 Emerging Markets countries. The MSCI ACWI Index ex-U.S. captures large and mid-cap representation across 22 Developed Markets and 26 Emerging Markets countries, excluding the United States. The Bloomberg Barclay’s U.S. Aggregate Bond Index is a broad base index and is often used to represent investment grade bonds being traded in the United States.
“S&P 500®”, and “S&P Small Cap 600®” are registered trademarks of Standard & Poor’s, Inc., a division of S&P Global, Inc. MSCI® is the trademark of MSCI Inc. and/or its subsidiaries.
Beaumont Financial Partners, LLC-DBA Beaumont Capital Management,
250 1st Avenue, Suite 101, Needham, MA 02494 (844-401-7699)