
By Roman Chuyan, CFA
- We are in a severe recession – probably worse than in 2008 and the deepest since 1946.
- Yet, US stocks rebounded by 27% from late-March trough, now down only 16% from peak.
- After protecting against the entire downturn this year, we’re getting more aggressive in positioning for the expected market move.
In five weeks, 16% of the entire US labor force filed for unemployment. A 10% cumulative peak-to-trough GDP contraction is expected this year. If that comes to pass, it would be 2.5 times the size of the 2008-09 economic downturn when US GDP contracted by a cumulative 4%. We have definitely entered the most severe recession in at least 74 years, since 1946 when the manufacturing of war materiel ended in the aftermath of World War II and GDP contracted by 11.6%. I summarized the March economic numbers in my previous article (bookmark and revisit our ETF Strategist page for the latest articles), see Economic Focus below for the early survey-based numbers for April.
I like to say that the market is bipolar – it swings between euphoria and depression. It was all gloom near the March-23rd low point, when the S&P 500 closed down 30% for the year. Now, it’s all optimism as stocks rebounded by a whopping 27% from that trough. Granted, the Fed’s gone all-out to bridge the economy, and Congress passed a total of around $2.7 trillion of stimulus packages. The rebound gained momentum as the flattening of the pandemic curve was received positively. While horrible economic numbers were being reported for March and April – many the worst ever recorded – investors didn’t care one bit. Perhaps they expect a quick, V-shaped recovery from a deep but temporary downturn.
US and Foreign Stocks, 1 Year
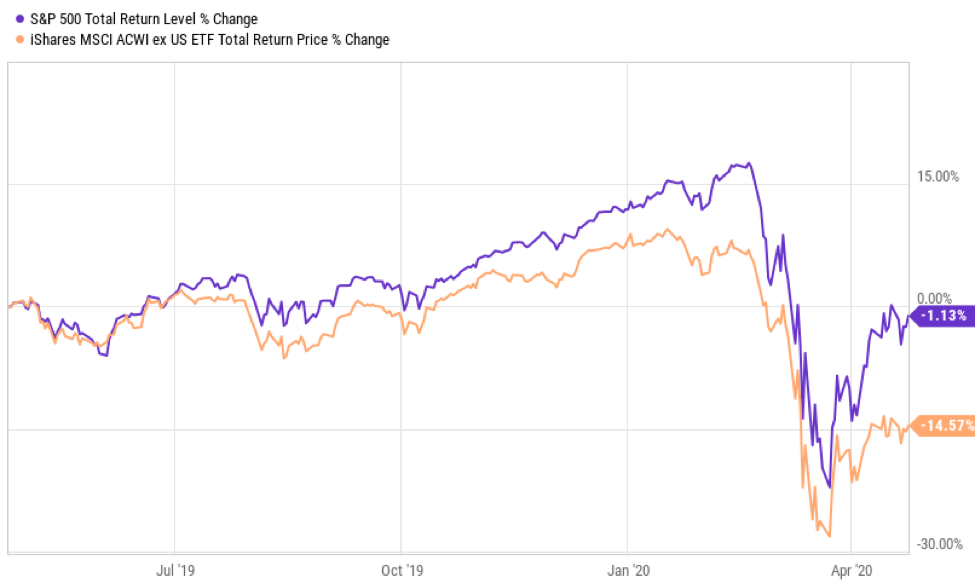
Source: Ycharts
Or perhaps they are just in shock and denial. People can’t think clearly in the midst of disruptive change. For most investors, their worldview was formed during the recent 11-year bull market. They are convinced that stocks always gain, buy-and-hold and buy-the-dip work. They can’t react rationally to this worldview crumbling.
Here are examples of absurdities I came across recently in financial press:
Why it’s not so crazy that stocks are rising even though 26 million people are out of work
The author points out, correctly, that Wall Street and “the whole system is set up for investors to buy stocks and keep them in stocks.” But if the system is set up for you to lose your savings so that it can make money, shouldn’t you quit the system (which is easy)? He then goes on, “even if unemployment reaches 20%, then 80% of the people are still employed.” Well, that’s encouraging.
The Market Rallied, but the Selloff Isn’t Over. Why You Should Buy Stocks Anyway.
I have a hard time articulating the logic here – maybe it’s like this: keep buying (and lose money) because everyone’s doing it.
What Prior Market Crashes Can Teach Us About Navigating the Current One
This article is well researched, by Morningstar Director of Research Paul D. Kaplan, PhD, CFA. The author reminds us that bear markets happen every nine years, on average. He compares the current situation with previous bear markets that match the steepness of the initial decline. These severe episodes, he writes, “had an average of 57 months [before]the market hit its trough and a 57% decline” – that is, they last for almost 5 years, and destroy investors who lose more than half of their money! Yet, instead of a word of caution, he concludes that “the market did always eventually recover its value, and then some” (this is not exactly true) and “for investors who can stay in the market for the long run, equity markets still continue to provide rewards.” At the time of publication, the S&P 500 was down 17% from it Feb-19th peak – so, Kaplan appears to encourage investors to stay in the market for another 40% expected loss. Truly, old habits die hard.
It’s correct to compare the current situation to severe bear markets of the past, in my view, because of the severity of the current economic downturn, and of the market’s initial reaction. Here’s our comparison, for the first six months from peak (the timeline is from 2008). This chart shows that, while each bear market follows a slightly different path, they are remarkably similar, converging to a 30-40% decline in only 3-5 months. The 1990 crash of Japan’s Nikkei-225 is the only outlier, but it too converged to ‑40% in six months (that bear market continued for 30 years and has not reclaimed its previous peak to this day).

Source: Model Capital Management LLC
Our Positioning
We at Model Capital follow a fundamentals-based approach to tactical management. Fundamentals are more reliable then technical indicators or following charts which are open to interpretation. Our process is impartial, based on a program processing vast amounts of data. Complex algorithms aside, our approach looks at sum-total effect of 24 fundamental factors (such as market valuation and economic data) to determine the attractiveness of the stock market. We invest in the stock market if our equity model’s 6-month outlook for the S&P 500 is high enough, and stay defensive if it’s negative.
Our models gave negative signals in Nov-Dec of 2019 which allowed us to position defensively and helped us protect client assets against this entire downturn. We stayed defensive this year, although our Gold model turned positive in February, and our Credit models turned positive at the end of March. Accordingly, we moved up slightly on the risk curve, from T-Bills to investment-grade and HY credit (and gold ETFs in more aggressive strategies) – this allowed us to earn a reasonably good positive return for clients. We’re not perma-bears – we will eventually get back into the stock market – but not now.
In fact, our equity model has begun to turn more negative as horrible economic numbers came in for March and April. At the same time, the rebound made the stock market overvalued once again. This is the largest divergence between our fundamentals-based equity model and the market direction I’ve seen in a long time. Never a certainty, the probability of a significant market “leg down” has increased. We are, therefore, getting more aggressive in positioning for the expected market move in our more-aggressive strategy, Tactical 2xGrowth.
Economic Focus
Economic numbers for March were terrible as I detailed in my previous article. The early, survey-based numbers for April are not much better. After soaring to a weekly peak of 6.9 million – by far the highest on record – initial jobless claims ebbed a bit, to 4.4 million last week. In five weeks, we lost 16% of the entire US workforce. Such a massive loss of jobs has never happened before – we’re in uncharted territory.

The New York Empire State Manufacturing Index – one of the earliest manufacturing surveys for April – tumbled 56.7 points from the previous month to -78.2, the lowest level on record and well below market expectations of -35.0. Although New York was hit hard by the pandemic lockdowns, this is much worse than we’ve seen during the Great Recession of 2008-09:
Empire State Manufacturing Index

Durable goods orders plunged 14.4% in March on aircraft orders, worse than market forecasts of a 11.9% drop. It is the biggest drop since August of 2014 (which was a reversal of the earlier spike due to a tax incentive) and worse than at any time in the 2008-09 downturn.
US Durable Goods Orders, 25 Years

About Model Capital Management LLC
Model Capital Management LLC (“MCM”) is an independent SEC-registered investment advisor, and is based in Wellesley, Massachusetts. Utilizing its fundamental, forward-looking approach to asset allocation, MCM provides asset management services that help other advisors implement its dynamic investment strategies designed to reduce significant downside risk. MCM is available to advisors on AssetMark, Envestnet, and other SMA/UMA platforms, but is not affiliated with those firms.
Notices and Disclosures
- This research document, article or newsletter and all of the information contained in it (“MCM Research”) is the property of MCM. The Information set out in this communication is subject to copyright and may not be reproduced or disseminated, in whole or in part, without the express written permission of MCM. The trademarks and service marks contained in this document are the property of their respective owners. Third-party data providers make no warranties or representations relating to the accuracy, completeness, or timeliness of the data they provide and shall not have liability for any damages relating to such data.
- MCM does not provide individually tailored investment advice. MCM Research has been prepared without regard to the circumstances and objectives of those who receive it. MCM recommends that investors independently evaluate particular investments and strategies, and encourages investors to seek the advice of an investment adviser. The appropriateness of an investment or strategy will depend on an investor’s circumstances and objectives. The securities, instruments, or strategies discussed in MCM Research may not be suitable for all investors, and certain investors may not be eligible to purchase or participate in some or all of them. The value of and income from your investments may vary because of changes in securities/instruments prices, market indexes, or other factors. Past performance is not a guarantee of future performance, and not necessarily a guide to future performance. Estimates of future performance are based on assumptions that may not be realized.
- MCM Research is not an offer to buy or sell or the solicitation of an offer to buy or sell any security/instrument or to participate in any particular trading strategy. MCM does not analyze, follow, research or recommend individual companies or their securities. Employees of MCM may have investments in securities/instruments or derivatives of securities/instruments based on broad market indices included in MCM Research.
- MCM is not acting as a municipal advisor and the opinions or views contained in MCM Research are not intended to be, and do not constitute, advice within the meaning of Section 975 of the Dodd-Frank Wall Street Reform and Consumer Protection Act.
- MCM Research is based on public information. MCM makes every effort to use reliable, comprehensive information, but we make no representation that it is accurate or complete. We have no obligation to tell you when opinions or information in MCM Research change.
- MCM DOES NOT MAKE ANY EXPRESS OR IMPLIED WARRANTIES OR REPRESENTATIONS WITH RESPECT TO THIS MCM RESEARCH (OR THE RESULTS TO BE OBTAINED BY THE USE THEREOF), AND TO THE MAXIMUM EXTENT PERMITTED BY LAW, MCM HEREBY EXPRESSLY DISCLAIMS ALL WARRANTIES (INCLUDING, WITHOUT LIMITATION, ANY IMPLIED WARRANTIES OF ORIGINALITY, ACCURACY, TIMELINESS, NON-INFRINGEMENT, COMPLETENESS, MERCHANTABILITY AND/OR FITNESS FOR A PARTICULAR PURPOSE).
- Index returns referenced in MCM Research, if any, are gross of any advisory fees, fund management fees, and trading expenses. Fund or ETF returns referenced, if any, are gross of advisory fees and trading expenses. Returns will be reduced by fees and expenses incurred.
