
By Roman Chuyan, CFA
- Economic numbers for March are the worst in decades.
- A 10% peak-to-trough GDP contraction is expected this year – 2.5 times the 2008 downturn and the deepest since 1946.
In four weeks, 13.4% of the entire US labor force filed for unemployment. A 10% cumulative peak-to-trough GDP contraction is expected this year. If that comes to pass, it would be 2.5 times the size of the 2008-09 economic downturn when US GDP contracted by a cumulative 4%. We have definitely entered the most severe recession in at least 74 years, since 1946 when the manufacturing of war materiel ended in the aftermath of World War II and GDP contracted by 11.6%.
The 2008-09 downturn was called the “Great Recession” as it resulted in tremendous loss of jobs and wealth – an echo of the Great Depression. What will they call this one? We’ve somewhat overused the word “great.” The best I could come up with is the “Immense Recession.” I’m opening a contest for the name, let me know through our website’s contact form!
But stock investors are cheering. The S&P 500 is up 25% since its March-23rd trough – a tremendous split between the grim economic numbers and market action. Optimists point to unprecedented Fed stimulus, the coronavirus curve flattening, and the impending reopening of the economy. They undoubtedly expect a quick, V-shaped recovery from a deep but temporary downturn.
We at Model Capital follow a fundamentals-based approach, and we think that it would be unwise to chase the market up right now. Our fundamentals-based models point for the stock market to back down in the mid-term. It’s been euphoric in the past three weeks, but in its bipolar fashion the market will turn pessimistic once again.
Numbers Focus
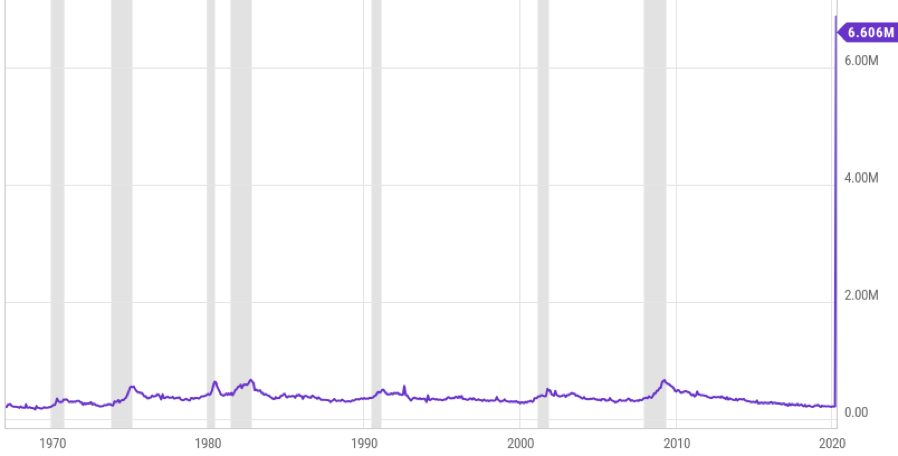
Economic numbers for March began to come in, and they are terrible. Initial jobless claims soared to between 5.2 and 6.9 million in each of the past three weeks – by far the largest job losses on record. In four weeks, we lost 13.4% of the entire US workforce of 164.6 million. Such a massive loss of jobs has never happened before – we’re in uncharted territory.
Initial Jobless Claims
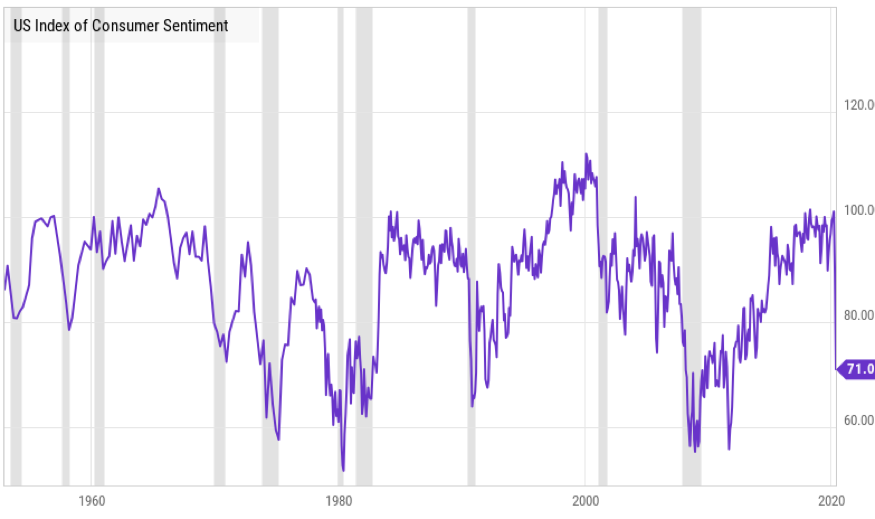
Consumer confidence has begun to decline. The University of Michigan’s sentiment dropped to 71 in April (see chart above), the first consumer survey since widespread quarantines were enacted. While it’s only the lowest level since 2011, it’s nonetheless a recessionary level – and the biggest one-month drop on record.
Retail sales plunged 8.7% month-over-month in March, worse than market forecasts of an 8% drop, and the biggest decline since records began in the early 1990’s.
US Retail Sales, MoM, 25 Years

Industrial production slumped 5.4% from a month earlier in March, the largest drop since 1946 and compared with market expectations of a 4% drop.
US Industrial Production, MoM, 25 Years

About Model Capital Management LLC
Model Capital Management LLC (“MCM”) is an independent SEC-registered investment advisor, and is based in Wellesley, Massachusetts. Utilizing its fundamental, forward-looking approach to asset allocation, MCM provides asset management services that help other advisors implement its dynamic investment strategies designed to reduce significant downside risk. MCM is available to advisors on AssetMark, Envestnet, and other SMA/UMA platforms, but is not affiliated with those firms.
Notices and Disclosures
- This research document and all of the information contained in it (“MCM Research”) is the property of MCM. The Information set out in this communication is subject to copyright and may not be reproduced or disseminated, in whole or in part, without the express written permission of MCM. The trademarks and service marks contained in this document are the property of their respective owners. Third-party data providers make no warranties or representations relating to the accuracy, completeness, or timeliness of the data they provide and shall not have liability for any damages relating to such data.
- MCM does not provide individually tailored investment advice. MCM Research has been prepared without regard to the circumstances and objectives of those who receive it. MCM recommends that investors independently evaluate particular investments and strategies, and encourages investors to seek the advice of an investment adviser. The appropriateness of an investment or strategy will depend on an investor’s circumstances and objectives. The securities, instruments, or strategies discussed in MCM Research may not be suitable for all investors, and certain investors may not be eligible to purchase or participate in some or all of them. The value of and income from your investments may vary because of changes in securities/instruments prices, market indexes, or other factors. Past performance is not a guarantee of future performance, and not necessarily a guide to future performance. Estimates of future performance are based on assumptions that may not be realized.
- MCM Research is not an offer to buy or sell or the solicitation of an offer to buy or sell any security/instrument or to participate in any particular trading strategy. MCM does not analyze, follow, research or recommend individual companies or their securities. Employees of MCM may have investments in securities/instruments or derivatives of securities/instruments based on broad market indices included in MCM Research.
- MCM is not acting as a municipal advisor and the opinions or views contained in MCM Research are not intended to be, and do not constitute, advice within the meaning of Section 975 of the Dodd-Frank Wall Street Reform and Consumer Protection Act.
- MCM Research is based on public information. MCM makes every effort to use reliable, comprehensive information, but we make no representation that it is accurate or complete. We have no obligation to tell you when opinions or information in MCM Research change.
- MCM DOES NOT MAKE ANY EXPRESS OR IMPLIED WARRANTIES OR REPRESENTATIONS WITH RESPECT TO THIS MCM RESEARCH (OR THE RESULTS TO BE OBTAINED BY THE USE THEREOF), AND TO THE MAXIMUM EXTENT PERMITTED BY LAW, MCM HEREBY EXPRESSLY DISCLAIMS ALL WARRANTIES (INCLUDING, WITHOUT LIMITATION, ANY IMPLIED WARRANTIES OF ORIGINALITY, ACCURACY, TIMELINESS, NON-INFRINGEMENT, COMPLETENESS, MERCHANTABILITY AND/OR FITNESS FOR A PARTICULAR PURPOSE).
- “Model Return Forecast” for 6-month S&P 500 return is MCM’s measure of attractiveness of the U.S. equity market obtained by applying MCM’s proprietary statistical algorithm and historical data, but is not promissory, and, by itself, does not constitute an investment recommendation. Model Return Forecasts were calculated and applied by MCM to its research and investment process in real time beginning from 2012. For periods prior to Jan 2012, the results are “back-tested,” i.e., obtained by retroactively applying MCM’s algorithm and historical data available in Jan 2012 or thereafter. Source for the S&P 500 actual returns: S&P Dow Jones.
- Index returns referenced in MCM Research, if any, are gross of any advisory fees, fund management fees, and trading expenses. Fund or ETF returns referenced, if any, are gross of advisory fees and trading expenses. Returns will be reduced by fees and expenses incurred.
