
SUMMARY
- We think the election race is closer than polls suggest.
- Despite drastically different agendas, we believe the market impact might not be as different as you might think.
- Whether Trump or Biden in 2021, we will play the hand we’re dealt unemotionally.
Three Weeks Feel like an Eternity
This piece lays out our views on the most frequently asked questions we have been fielding on the 2020 US election, now less than three weeks away. Markets are data driven… whether President Donald Trump or Joe Biden in 2021, we will play the hand we’re dealt unemotionally. Our answers are, in the end, less important to RiverFront’s portfolio returns than our ‘process over prediction’ methodology. Our tactical tools measure policymaker action, stock price trends, and crowd psychology in order to guide our tactical and risk management shifts. Whatever ‘side’ you’re on, RiverFront is on yours. Grit your teeth, hunker down, and start counting down the days.

#1: Will the polls get it right this time around?
Joe Biden has a higher probability of victory this time around than Hillary Clinton had at this juncture in 2016… but we think the election race is closer than it seems.
Most quantitative models point toward a Biden win.
Biden is polling better than Hillary Clinton was at this juncture in 2016. High-profile non-partisan models such as fivethirtyeight.com and the Good Judgement Project ‘Superforecasters’, are all currently predicting above an 80% probability of Former Vice President Joe Biden winning. ‘Real money’ betting markets, such as PredictIt, are also pricing in a Joe Biden victory.
However, we think it may be much closer than polls suggest.
While polling methodology has evolved since 2016 in order to improve accuracy, it’s still very possible that the 2020 election results will defy pollsters, especially considering the tight races in many battleground states. Also, the 2016 election ushered in the concept of the ‘shy’ Trump supporter…the group that votes to re-elect President Trump but won’t broadcast doing so in polls. A recent Cato Research poll suggests 62% of Americans feel uncomfortable sharing their political views, and a CloudResearch poll suggests Republican voters may be twice as reluctant to share their preference as Democrats.
Every incumbent president presiding over a recession in two years prior to election lost…. but this is no ordinary recession.
Government stimulus is softening the impact of the recession on voters, with real per-capita disposable income up strongly year over year. It’s also worth noting the recent strength in the NFIB Small Business Optimism index (see chart below). The September reading is now back to pre-pandemic levels and above the historical average. Recall that this index spiked to an all-time high immediately following the election of Donald Trump in 2016, suggesting that survey respondents broadly viewed Trump as positive for future small business prospects.

Market performance since August favors Trump.
Since August 1 the stock market is up 6.9%; as we mentioned in RiverFront’s Election Infographic, strong markets from August into the election historically portend re-election for the incumbent.
#2: Which candidate is better for the stock market?
Despite drastically different agendas, the two candidates’ aggregate impact on the market might not be as different as believed.
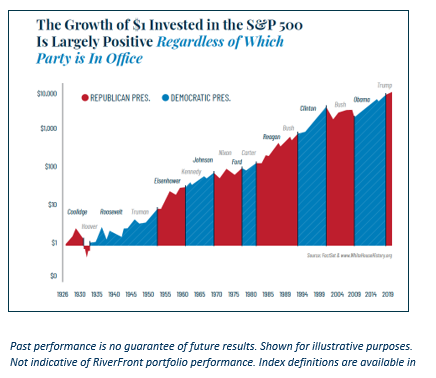
The US stock market, over the last century, has generally trended upward despite 10 presidential party changeovers – see our chart (below) from RiverFront’s Election Infographic. Most presidential races are billed by partisans on both sides as a ‘gamechanger’ but from a historical market perspective, they haven’t been. Importantly, the US political process was designed for checks and balances. The mid-term congressional elections, occurring two years after the presidential election, can serve as a built-in course corrector when voters are dissatisfied with a particular political direction.
But is this election different, given the unusually stark differences in economic and social visions between the two parties? We believe President Trump’s platform of deregulation and lower taxes is positive for US corporate earnings, which is an important intermediate-term driver for stock market returns, in our opinion. However, bundled alongside those business-friendly policies are a tariff-based approach to trade, and controversial stances on domestic social issues. These have created volatility and uncertainty, which can curtail not only corporate earnings but the valuation the market assigns to those earnings.
Upon first glance, Biden’s proposed tax hikes on corporate profits, personal income for high earners, capital gains, and estate taxes would significantly lower US corporate earnings and may damage sentiment. Additionally, some investors have concerns that Biden’s plan to raise the capital gains tax could be harmful to stock market valuation. However, previous cap gain hikes– in 1986 and again in 2012 – did not fundamentally alter the attractiveness of stocks, in our view. On the flip side, Biden is also expected to bring more orthodox, less confrontational domestic and foreign relations and trade policies. Biden’s proposed large fiscal spending and a rollback of tariffs would help both the US and international economies, in our opinion. Biden’s intention to raise federal minimum wage may also be positive for consumer sentiment, without dramatically damaging corporate margins.
This mix of positives and negatives has Wall Street analysts split on the overall market impact of a Biden presidency.
A widely discussed Goldman Sachs report from late September suggests these offsetting impacts (as mentioned above) would actually boost US earnings-per-share in 2021 and have a very minimal overall impact on earnings-per-share out to 2024, relative to a continuation of current policy. This assumption does not account for any second-order effects to business, consumer, or investor confidence, which are highly dependent on other economic factors beyond the scope of the election.
The ability for Biden to successfully enact the full scope of his tax plan also depends on the composition of the Senate.
In the Senate, Democrats currently hold 47 seats and thus need to pick up 4 seats to gain a majority. There are 35 seats up for grabs in the Senate including 23 currently held by Republicans, and the House is expected to remain a Democratic majority. A Democratic majority in Congress is now the highest likelihood outcome, according the Good Judgment Project, at roughly a 79% probability. But even if Democrats gain a slim majority in the Senate, it may be difficult to enact wide-reaching changes to the tax code. Given the difficult economic situation that Biden would likely be inheriting, we are skeptical that the full scope of Democratic tax hikes would be adopted in 2021.
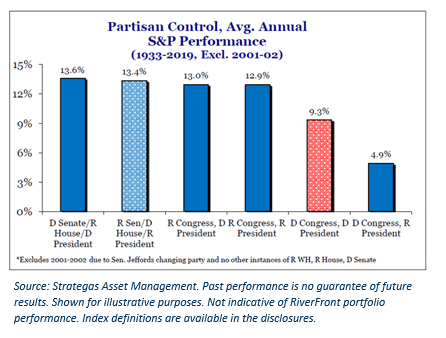
History suggests that ‘gridlock’ – when party control is split between legislative and executive branches and no one party holds all the cards– tends to be the best backdrop for stocks if split three ways. Though markets have averaged positive annual gains in all historical political scenarios since 1933, according to data from Strategas Research (see chart below). A Democratic Congress with a Democratic president has been below average, as has a Democratic Congress with a Republican president. Importantly, American companies, the most productive in the world, have historically found a way to generate profits regardless of the political backdrop.
#3: What Happens If We Don’t Know Who the President is on November 4th?
Market selloff, but likely short-lived; stimulus and interest rate policy more important to market than election in intermediate-term.
There is a very real possibility that we will not know the results of the election on Election Day. Good Judgement Project ‘Superforecasters’ currently state there is roughly a 70% probability that the losing party won’t concede by the end of election week (Sunday, November 8th), and a 25% probability we still won’t know the victory by Thanksgiving. There are a number of states that do not even start processing their ballots until Election Day. Therefore, it could take days, or even weeks, to have the results of the election. If the numbers are close, there is certainly a chance that the losing party challenges the results – leading to further volatility. In an electoral tie, the House of Representatives decides the election. In a contested election, however, the final decision is likely to go all the way to the Supreme Court, as it did in the year 2000. Some crucial dates to watch include the ‘safe harbor’ deadline on December 8th – the deadline for states to resolve any election dispute – and December 14th, the day Electoral College voters cast their official ballots for the president.
Markets dislike uncertainty…but uncertainty will be relatively short-lived in any case.
Using historical precedent, uncertainty effects on the stock market would dissipate relatively quickly as the winner becomes known. Regardless of which candidate is victorious, in our opinion, stimulus and Federal Reserve policy are more powerful drivers of intermediate-term market returns than politics. Should a crisis of confidence occur due to the election results, we believe the Federal Reserve and policymakers will likely continue to step into the breach to shore up consumer and business confidence, as they have all year.
Originally published by RiverFront Investment Group, 10/19/20
Important Disclosure Information
The comments above refer generally to financial markets and not RiverFront portfolios or any related performance. Opinions expressed are current as of the date shown and are subject to change. Past performance is not indicative of future results and diversification does not ensure a profit or protect against loss. All investments carry some level of risk, including loss of principal. An investment cannot be made directly in an index.
Chartered Financial Analyst is a professional designation given by the CFA Institute (formerly AIMR) that measures the competence and integrity of financial analysts. Candidates are required to pass three levels of exams covering areas such as accounting, economics, ethics, money management and security analysis. Four years of investment/financial career experience are required before one can become a CFA charterholder. Enrollees in the program must hold a bachelor’s degree.
Information or data shown or used in this material was received from sources believed to be reliable, but accuracy is not guaranteed.
This report does not provide recipients with information or advice that is sufficient on which to base an investment decision. This report does not take into account the specific investment objectives, financial situation or need of any particular client and may not be suitable for all types of investors. Recipients should consider the contents of this report as a single factor in making an investment decision. Additional fundamental and other analyses would be required to make an investment decision about any individual security identified in this report.
In a rising interest rate environment, the value of fixed-income securities generally declines.
Investing in foreign companies poses additional risks since political and economic events unique to a country or region may affect those markets and their issuers. In addition to such general international risks, the portfolio may also be exposed to currency fluctuation risks and emerging markets risks as described further below.
Changes in the value of foreign currencies compared to the U.S. dollar may affect (positively or negatively) the value of the portfolio’s investments. Such currency movements may occur separately from, and/or in response to, events that do not otherwise affect the value of the security in the issuer’s home country. Also, the value of the portfolio may be influenced by currency exchange control regulations. The currencies of emerging market countries may experience significant declines against the U.S. dollar, and devaluation may occur subsequent to investments in these currencies by the portfolio.
Foreign investments, especially investments in emerging markets, can be riskier and more volatile than investments in the U.S. and are considered speculative and subject to heightened risks in addition to the general risks of investing in non-U.S. securities. Also, inflation and rapid fluctuations in inflation rates have had, and may continue to have, negative effects on the economies and securities markets of certain emerging market countries.
Stocks represent partial ownership of a corporation. If the corporation does well, its value increases, and investors share in the appreciation. However, if it goes bankrupt, or performs poorly, investors can lose their entire initial investment (i.e., the stock price can go to zero). Bonds represent a loan made by an investor to a corporation or government. As such, the investor gets a guaranteed interest rate for a specific period of time and expects to get their original investment back at the end of that time period, along with the interest earned. Investment risk is repayment of the principal (amount invested). In the event of a bankruptcy or other corporate disruption, bonds are senior to stocks. Investors should be aware of these differences prior to investing.
Standard & Poor’s (S&P) 500 Index measures the performance of 500 large cap stocks, which together represent about 80% of the total US equities market.
The National Federation of Independent Business (NFIB) Small Business Optimism Index is a composite of ten seasonally adjusted components. It provides a indication of the health of small businesses in the U.S., which account of roughly 50% of the nation’s private workforce.
RiverFront has entered into a Model Provider Agreement with Strategas Asset Management (“SAM”), whereby SAM provides an investment model that is used to make the investment selections for the RiverFront Strategas Policy Opportunities (“RSPO”) portfolio. SAM is a registered investment advisor wholly owned by Baird Financial Corp. (“BFC”). SAM is an affiliate of RiverFront but is operationally independent from RiverFront. The model portfolio is generated by SAM’s affiliate, Strategas Securities, LLC (“STS”), a FINRA member broker-dealer and registered investment adviser. SAM, pursuant to an agreement with STS is authorized to offer and distribute the model portfolios to its clients, including RiverFront. STS is also wholly owned by BFC and an affiliate of RiverFront. Baird, SAM, STS and RiverFront are all affiliated entities via their common ownership under BFC.
RiverFront Investment Group, LLC (“RiverFront”), is a registered investment adviser with the Securities and Exchange Commission. Registration as an investment adviser does not imply any level of skill or expertise. Any discussion of specific securities is provided for informational purposes only and should not be deemed as investment advice or a recommendation to buy or sell any individual security mentioned. RiverFront is affiliated with Robert W. Baird & Co. Incorporated (“Baird”), member FINRA/SIPC, from its minority ownership interest in RiverFront. RiverFront is owned primarily by its employees through RiverFront Investment Holding Group, LLC, the holding company for RiverFront. Baird Financial Corporation (BFC) is a minority owner of RiverFront Investment Holding Group, LLC and therefore an indirect owner of RiverFront. BFC is the parent company of Robert W. Baird & Co. Incorporated, a registered broker/dealer and investment adviser.
To review other risks and more information about RiverFront, please visit the website at www.riverfrontig.com and the Form ADV, Part 2A. Copyright ©2020 RiverFront Investment Group. All Rights Reserved. ID: 1374773
