2. Relative Strength and Momentum has shifted to International Markets
According to Point and Figure charts and relative strength, momentum for International markets has finally broken out. This is shown by the four stacked green X’s in the chart below. Point and Figure charts analyze supply and demand of an investment, while evaluating price trends over the long term to determine entry and exit points. PFP charting show that now is the time to buy into International.
3. History as a Guide
We’ve written about the cyclical nature of U.S. market performance vs International market performance before. You can find that article here: A Differentiated ETF Approach to Managing Global Equities.

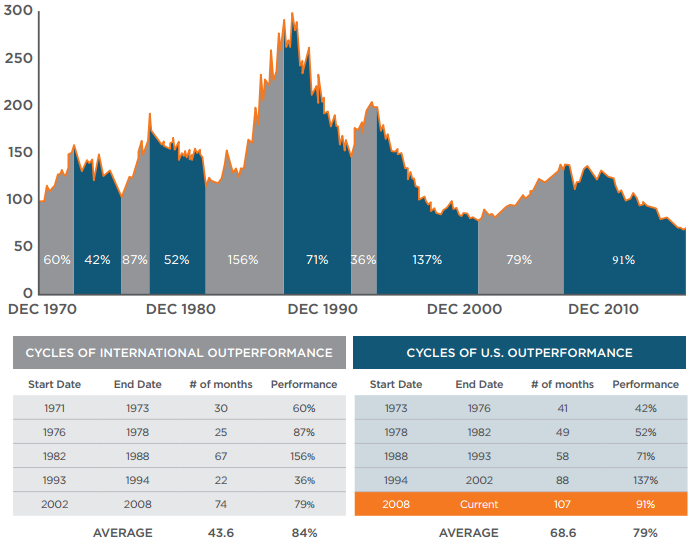
For the last 107+ months, U.S. markets have outperformed relative to International markets, leading to roughly 91% of outperformance. This is the longest U.S. bull market cycle since 1970, stretched (to say the least) significantly versus history where the average length of a U.S. outperformance cycles is only 68 months.
These 3 reasons help show that this historically cyclical nature has “turned” and now it is time for International markets to have their run.
This article was written by Dustin Blodgett, Head of National Sales at Accuvest Global Advisors, a participant in the ETF Strategist Channel.

