It’s been an impressive 2023 for U.S. large-cap equities. The iShares Core S&P 500 ETF (IVV) had risen 19% as of July 24, with consumer discretionary and information technology stocks leading the way. However, many advisors recently told VettaFi that they believe other strategies will perform better in the remainder of 2023.
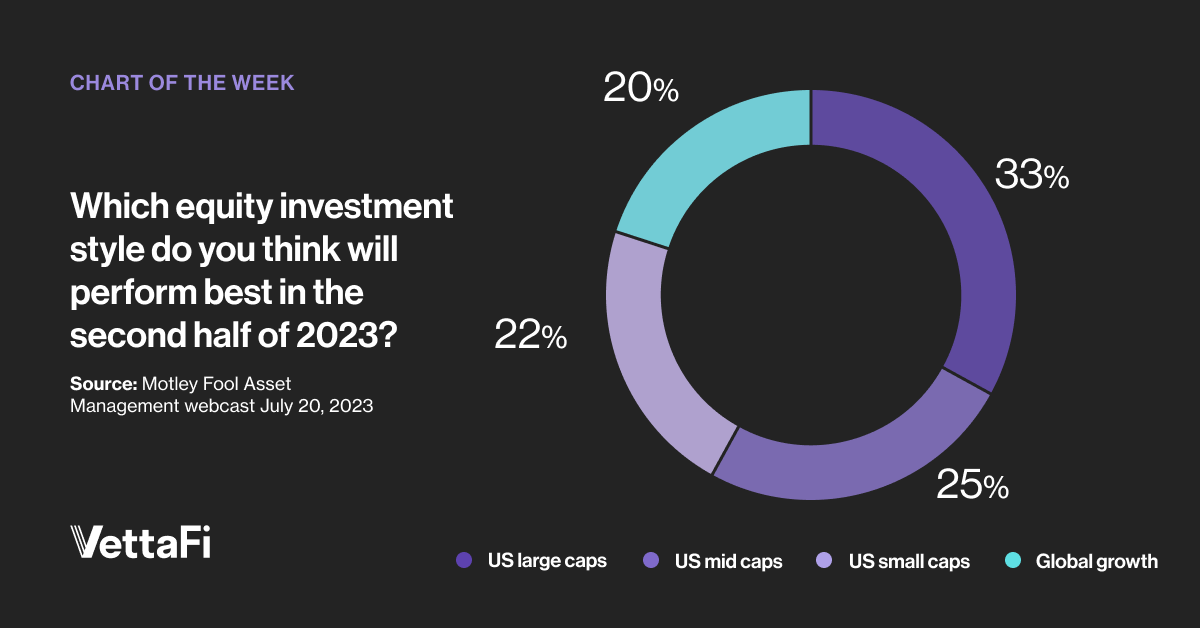
VettaFi hosted a webcast for financial advisors in partnership with Motley Fool Asset Management in late July. We asked, “Which equity investment style do you think will perform best in the second half of 2023?” Only one-third of respondents chose U.S. large-caps, with the three remaining options splitting the vote. The most popular was U.S. mid-caps (25%), followed by U.S. small-caps (22%), and then global growth (20%).
The iShares Core S&P Mid Cap ETF (IJH) is the largest U.S. mid-cap ETF. IJH has $73 billion in assets, aided by $925 million of net inflows in the past month. IJH’s year-to-date total return of 12.4% lagged IVV, but its double-digit gain should still please many of its shareholders.
What’s Inside a Mid-Cap ETF?
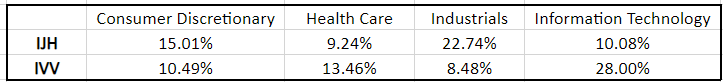 IJH’s largest sector is industrials (23% of assets), with a weighting nearly triple that of IVV (8.5%). In contrast, IJH’s 10% stake in information technology stocks is almost one-third the size of IVV (28%). Five of IJH’s recent top-10 holdings were industrial stocks. Builders FirstSource (BLDR), Graco (GGG), and Hubbell (HUBB) were the largest, though none of them represented more than 1% of ETF assets.
Mid-Caps Offer a Less Concentrated Approach
In contrast, 14 stocks in IVV had larger than 1.0% weightings, led by information technology giants Apple (AAPL) and Microsoft (MSFT). IJH’s information technology exposure includes positions in Jabil (JBL) and Super Micro Computer.
With a net expense ratio of 0.05%, IJH is a low-cost way for advisors to obtain diversified mid-cap exposure. However, there are other alternatives.
Vanguard’s Mid-Cap ETF Is Built Differently
The Vanguard Mid-Cap ETF (VO) charges a 0.04% fee, and its $56 billion asset base makes it the second-largest fund in the style. VO tracks a different index than IJH, from CRSP, which results in distinct exposure. For example, the $26 billion median market capitalization of VO’s holdings at the end of June was much higher than IJH’s ($5.5 billion).
Industrials were again the largest sector, but the 18% weighting for VO was more modest than IJH’s. Meanwhile, VO had 14% invested in information technology stocks. Cintas (CTAS) and PACCAR (PCAR), two of VO’s largest industrial positions, were among the smallest stakes in IVV. This should serve as a reminder to look inside ETFs when pairing them.
What Other Mid-Cap ETFs Are Available?
The iShares Russell Mid-Cap ETF (IWR), the Schwab US Mid-Cap ETF (SCHM), and the SPDR S&P MidCap 400 ETF (MDY) are other mid-cap ETFs with more than $10 billion in assets under management. MDY tracks the same index as IJR, while IWR and SCHM are distinct. Advisors that believe mid-cap ETFs can perform best in the second half have some strong index-based choices.
For more news, information, and analysis, visit the Equity ETF Channel.