

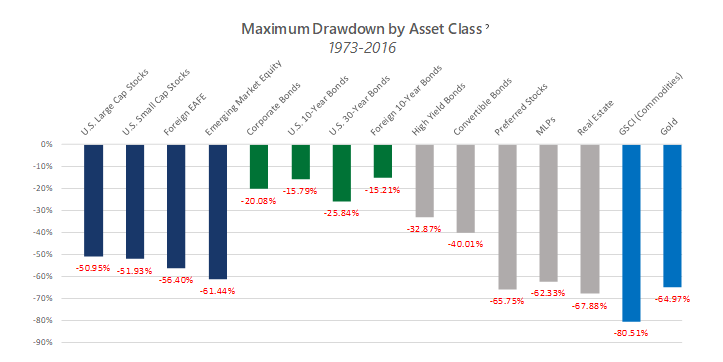
We have been enjoying the second longest equity bull market in history. It might go on for years. Or not. After years of stock and bond gains, now is the time to look at your portfolios for unnecessary risks. As the chart below shows, all asset classes undergo periods of failure. Adjusting after they happen makes no sense as it will be too late. For those worried about capital gains, is it better to pay tax on some profit or risk giving back all the profit? Now is the time to rebalance! As you go into your year-end manager reviews, consider growth strategies that have built-in, rules-based defensive disciplines. It will be a much better outcome than waiting for the bars below to come to life.
This article was contributed by the team at Beaumont Capital Management, a participant in the ETF Strategist Channel.
Source: Bloomberg; Indices performance represented by (in same order as listed above): Bloomberg Barclays U.S. Corporate High Yield Index; Hard Currency (USD Denominated): Bloomberg Barclays EM USD Aggregate Index; Local Currency: Bloomberg Barclays EM Local Currency Government Index; EM High Yield to match chart below: Bloomberg Barclays Emerging Market High Yield Index; Bloomberg Barclays U.S. Government 10 Year Term Index.
Source: Global Asset Allocation (Chapter 3) via mebfaber.com, Meb Faber, March 6, 2015. Bloomberg for the period 1973-2016. The data shown for Convertible Bonds, Preferred stock, High Yield Bonds and MLPs is sourced by Bloomberg. They use the same end date as the rest of the asset classes (12/31/16), but have different starting dates due to the fact the indices for these asset classes did not exist in 1973. Convertible bonds is for the time period starting on 6/17/1986, Preferred stock data starts 9/9/2003 and the MLP data begins 12/21/1995. The returns shown are “Nominal Returns” for the time period specified. For more information on what each asset class performance is represented by, please reference the disclosure pages. “EAFE” represents the regions of Europe, Australasia and Far East. Past performance is no guarantee of future results. An investment cannot be made directly in an index. Asset class performance is represented by the following: U.S. Large Cap – S&P 500; U.S. Small Cap – French Fama Small Cap; Foreign Developed – MSCI EAFE; Foreign Emerging – MSCI EEM; Corporate Bonds – Dow Jones Corporate; T-Bills – U.S. Bills; 10 Year Bonds – U.S. 10-year bonds; 30 Year Bonds – U.S. 30-year bonds; 10 Year Foreign Bonds – Foreign 10-year bonds; High Yield – iBoxx Liquid High Yield; Convertible Bonds – Vanguard Convertible Securities Fund; Preferred Stocks – S&P Preferred Stock; MLPs – Alerian MLP; REITs – NAREIT; Commodities – GSCI; Gold – GFD.
Copyright © 2017 Beaumont Financial Partners, LLC. All rights reserved.
This material is for informational purposes only. It is not intended as an offer or solicitation for the purchase or sale of any security or financial instrument, nor should it be construed as financial or investment advice. The information presented in this report is based on data obtained from third party sources. Although it is believed to be accurate, no representation or warranty is made as to its accuracy or completeness.
Past performance is no guarantee of future results. Diversification does not ensure a profit or guarantee against a loss. As with all investments, there are associated inherent risks. An investment cannot be made directly in an index.
Fixed Income investments are subject to inflationary, credit, market and interest rate risks.
The views and opinions expressed throughout this article are those of our Portfolio Manager as of October 2017. The opinions and outlooks may change over time with changing market conditions or other relevant variables.
Beaumont Financial Partners, LLC DBA Beaumont Capital Management, 250 1st Avenue, Suite 101, Needham, MA 02494, (844) 401-7699