
European equities have been attracting interest from U.S. investors who may be nervous about the future of domestic markets and looking to diversify by investing overseas. Two of the largest ETFs covering developed markets in Europe have pulled in billions in assets during 2023.
Although the two funds are very similar, data from LOGICLY highlights some of the subtle differences between the JPMorgan BetaBuilders Europe ETF (BBEU), and the Vanguard FTSE Europe ETF (VGK), which have gained $3.9 billion and $2.1 billion in new assets year-to-date. Interestingly, both funds saw the bulk of those inflows added in the early months of the year. The fund’s largest outflows of 2023 were in late June.
Comparison of Two Europe ETFs
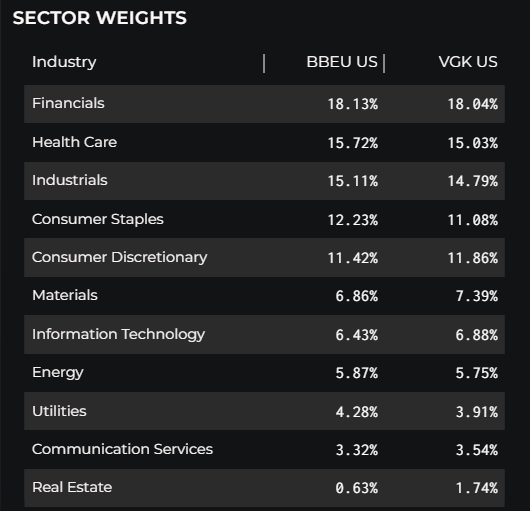
Sector Weights for BBEU and VGK per LOGICLY.
VGK offers exposure to a range of developed economies in Europe and tracks the cap-weighted FTSE All Cap Developed Europe index. It has an expense ratio of 0.11% and was launched in 2005. Currently, it has more than $19 billion in assets under management.
See more: “Exploring Japan ETFs: Top Performers and Investment Opportunities”
BBEU on the other hand tracks the Morningstar Developed Europe Target Market Exposure Index, another cap-weighted benchmark. The fund has an expense ratio of 0.09% and currently has $6.6 billion in assets. However, while VGK has nearly 20 years of trading under its belt, BBEU only launched about five years ago. It is slightly cheaper than VGK, with an expense ratio of 0.09%, a difference of two basis points.
Sector weightings between the two are virtually identical, with the largest differences showing up in real estate and consumer staples. The real estate sector has a 0.63% weighting in BBEU and a 1.74% weighting in VGK, while the consumer staples sector has a 12.23% weighting in BBEU and an 11.08% weighting in VGK.
Europe ETFs’ Performance
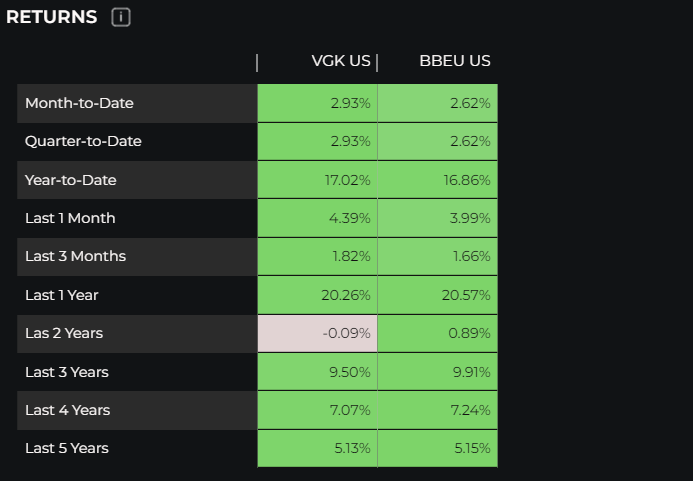
VGK and BBEU returns per LOGICLY.
VGK has slightly outperformed BBEU this year by posting a YTD return of 17.02% in contrast to BBEU’s 16.86%. BBEU has slightly outperformed VGK on an annualized basis over the longer time periods shown in the table above.
See more: “3 Key Country ETFs Have Viable Alternatives”
Digging Into Holdings
Both funds include the exact same stocks among their top 10 holdings, but the weightings of those securities are slightly different. ASML Holding N.V. (ASML) is the fund’s second-largest holding and has posted a year-to-date return of 26.43%. Other top 10 stocks in common between the two funds such as HSBC Holdings plc, LVMH Moet Hennessy Louis Vuitton SE and Shell Plc have also demonstrated outsized performance relative to the two funds, boosting their returns.
However, if you take a bird’s eye view of the portfolios, one key difference emerges. BBEU has 453 holdings, while VGK has almost three times as many with a portfolio of more than 1,300 securities. This is probably the most glaring difference between the two funds. Investors choosing between them should consider whether they want to invest in a more focused portfolio or take a broader view of Europe’s developed markets that includes more exposure to small- and mid-caps.
For more news, information, and analysis, visit VettaFi | ETF Trends.
