Investors are paying close attention to China, Japan, and India ETFs lately, according to VettaFi’s Explorer data and analytics tool. Interest in non-U.S. economies is high as investors look for more ways to diversify their portfolios.
BlackRock’s iShares arm offers ETFs covering each of those markets that are the largest in their respective categories and have brought in the most assets year-to-date relative to their competitors. However, those competitors might be a better fit for some investors. The LOGICLY tool offers comparative data that can help put these funds in context in terms of their differences.
China and India ETFs in Focus
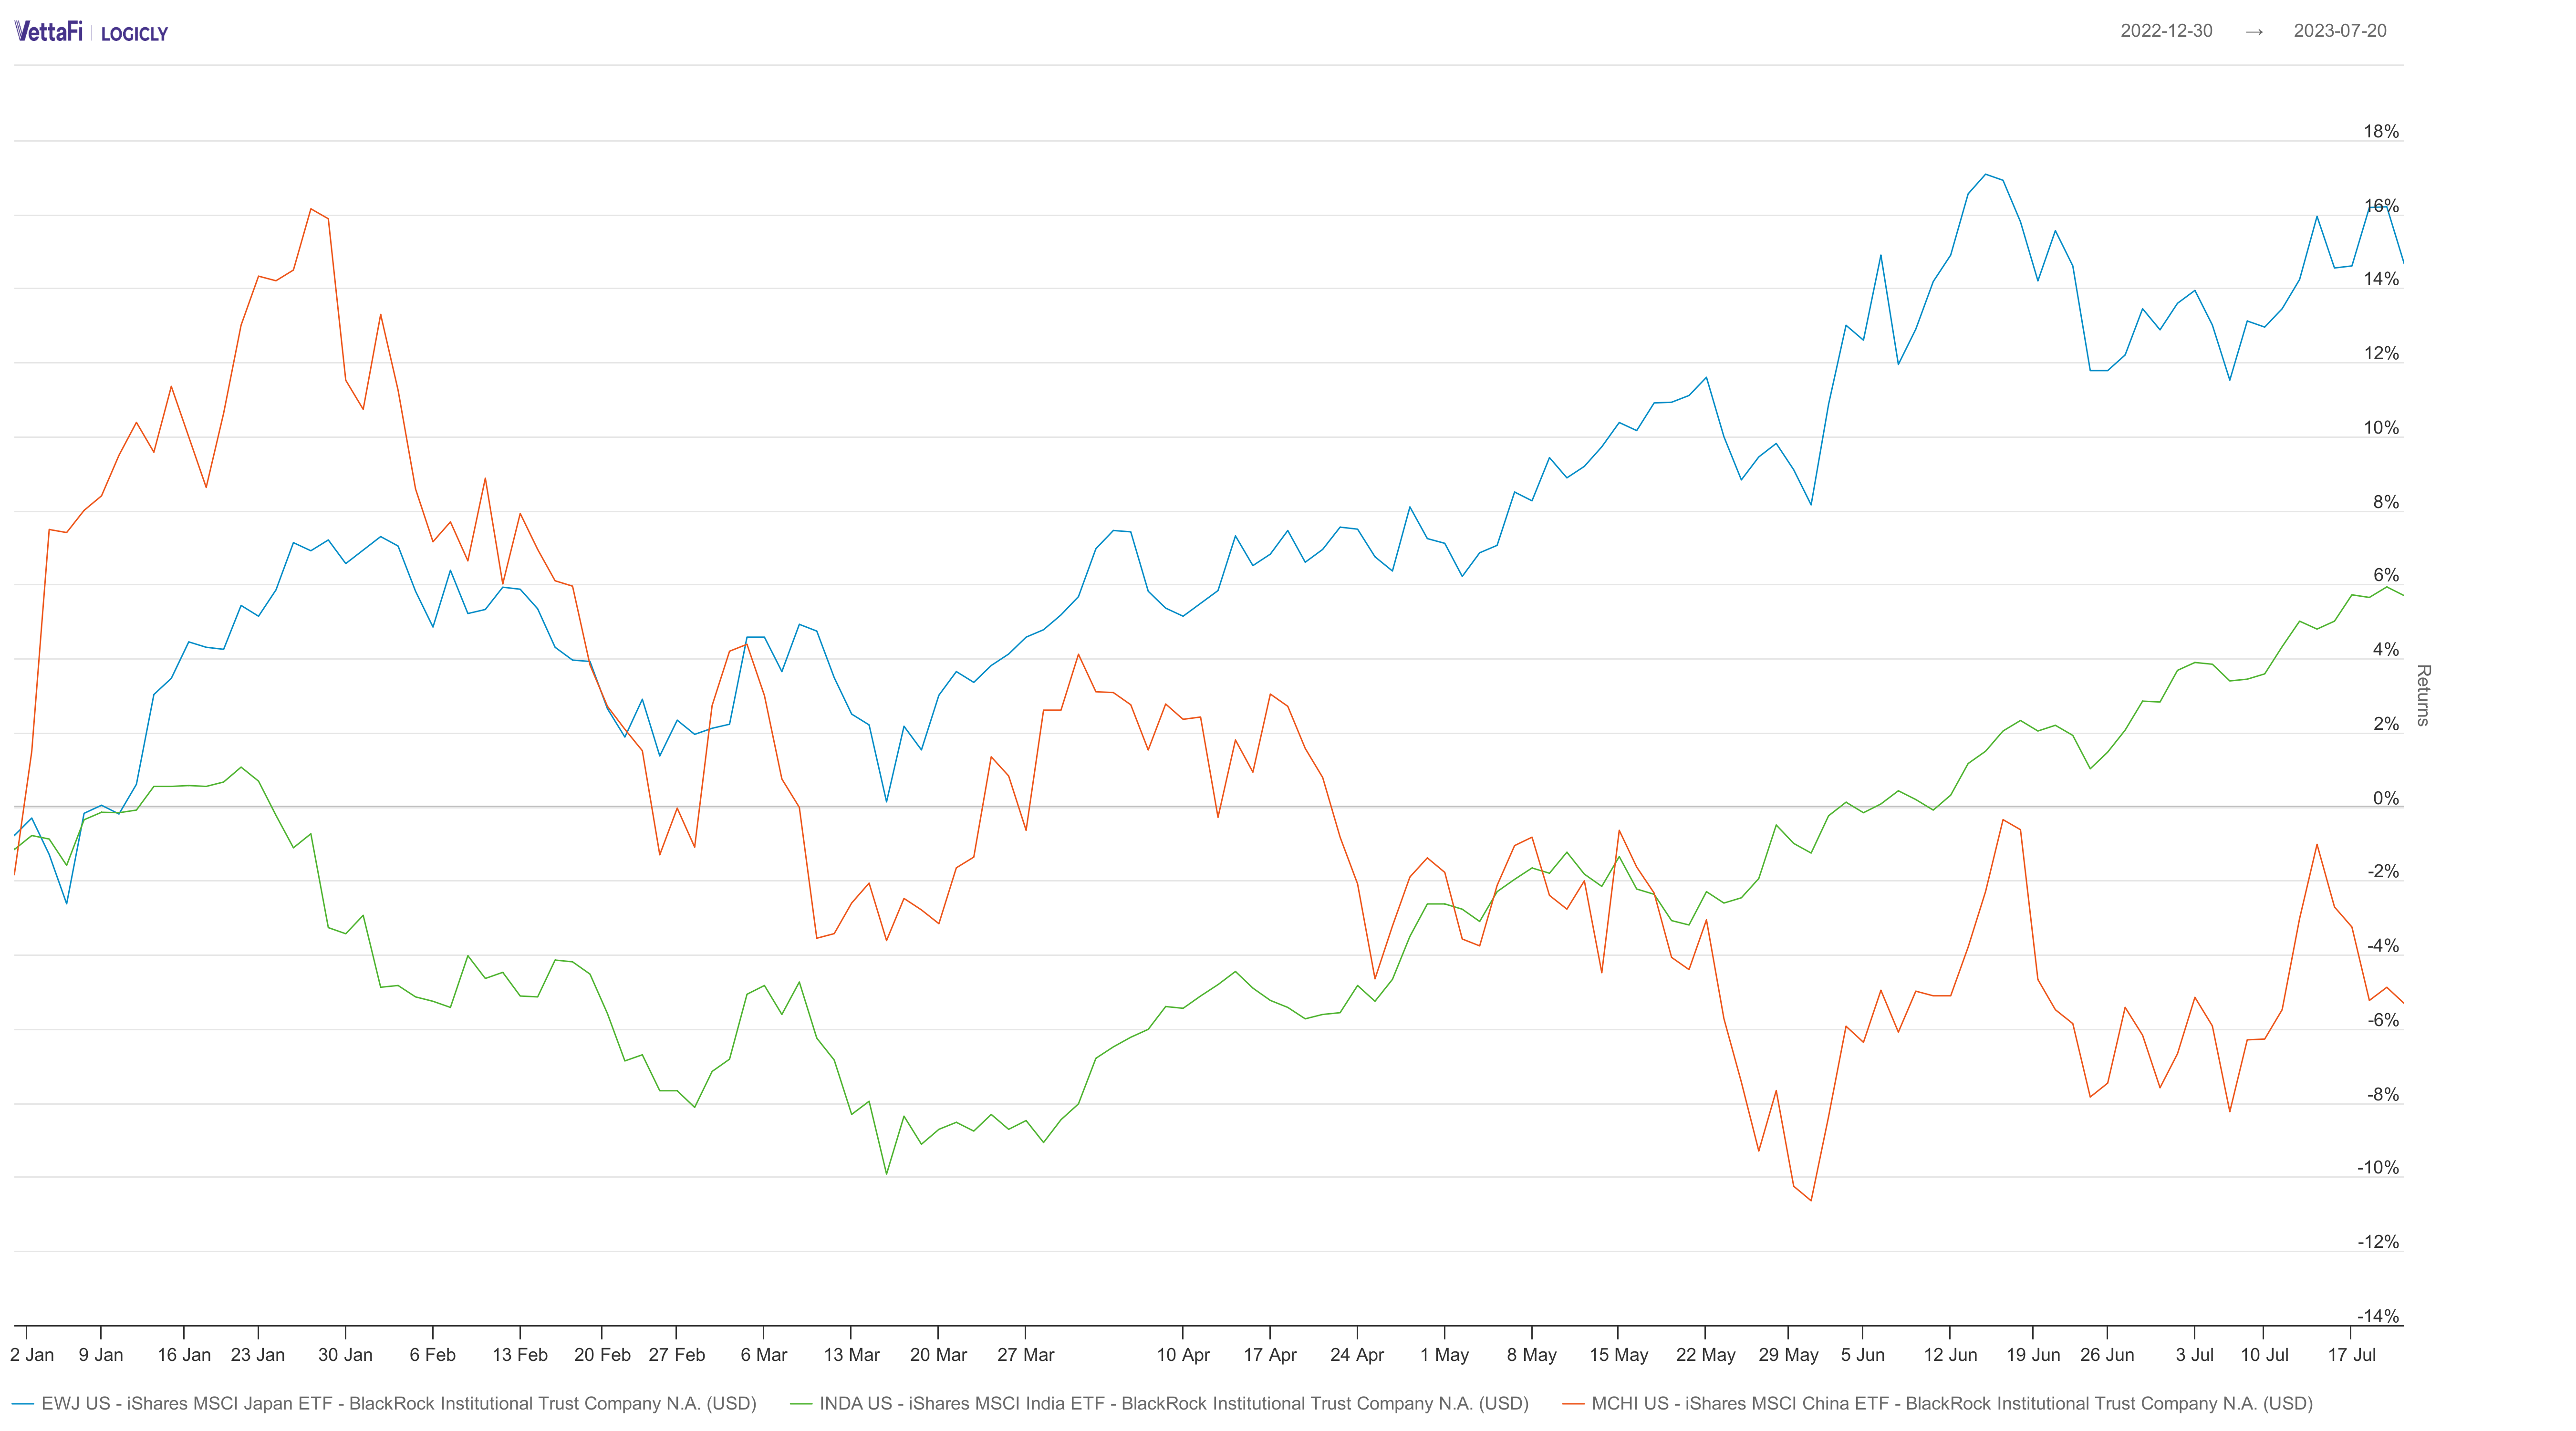
China, Japan, and India iShares ETFs YTD performance, per LOGICLY. Click to enlarge.
The iShares MSCI China ETF (MCHI) offers exposure to China’s equity market. The fund has brought in about $7.8 billion since it launched in March 2011. It also has an expense ratio of 0.58%, less than the average for funds in the same category. In terms of flows this year, MCHI gained $353.14 million. Despite a strong start to 2023, it has recorded a lackluster year-to-date return of -3.10%, underperforming the top iShares ETFs representing Japan and India.
Although MCHI started the year off strong, it took a downward turn in late January and is still in a slump despite the country lifting all remaining COVID restrictions in the spring. While investor interest has receded somewhat, it is still strong and may have been stabilized by Chinese President Xi Jinping remaining consistent in his expressed commitment to the country’s growth.
The iShares MSCI India ETF (INDA) has AUM of $5.9 billion and has added more than $940 million in inflows so far this year. The largest portion of those new assets was added this month. It has a YTD performance of 7.17% and posted a 14.27% annualized three-year return.
This year, India displaced China as the most populous country. It also currently ranks as the fifth-largest economy and had one of the best-performing stock markets in the second quarter of 2023.
See more: “Exploring Japan ETFs: Top Performers and Investment Opportunities”
Japan Stands Out
However, the iShares MSCI Japan ETF (EWJ) outperformed the other two iShares funds. EWJ is up 17.11% year-to-date, mainly due to an upturn in large-cap Japanese stocks. It has been on a strong upward trend since March. EWJ has more than $13 billion in assets under management, with $2.4 billion of that flowing into the fund this year. It has an expense ratio of 0.50%.
EWJ’s performance can be attributed at least in part to Japan’s efforts to stimulate growth and its corporate reforms. Those changes — and EWJ’s solid performance this year after several years of significant net outflows — no doubt also helped to reignite investor interest in Japan’s markets.
See more: “Is Now the Time To Consider India ETFs?”
Alternatives Single-Country ETFs
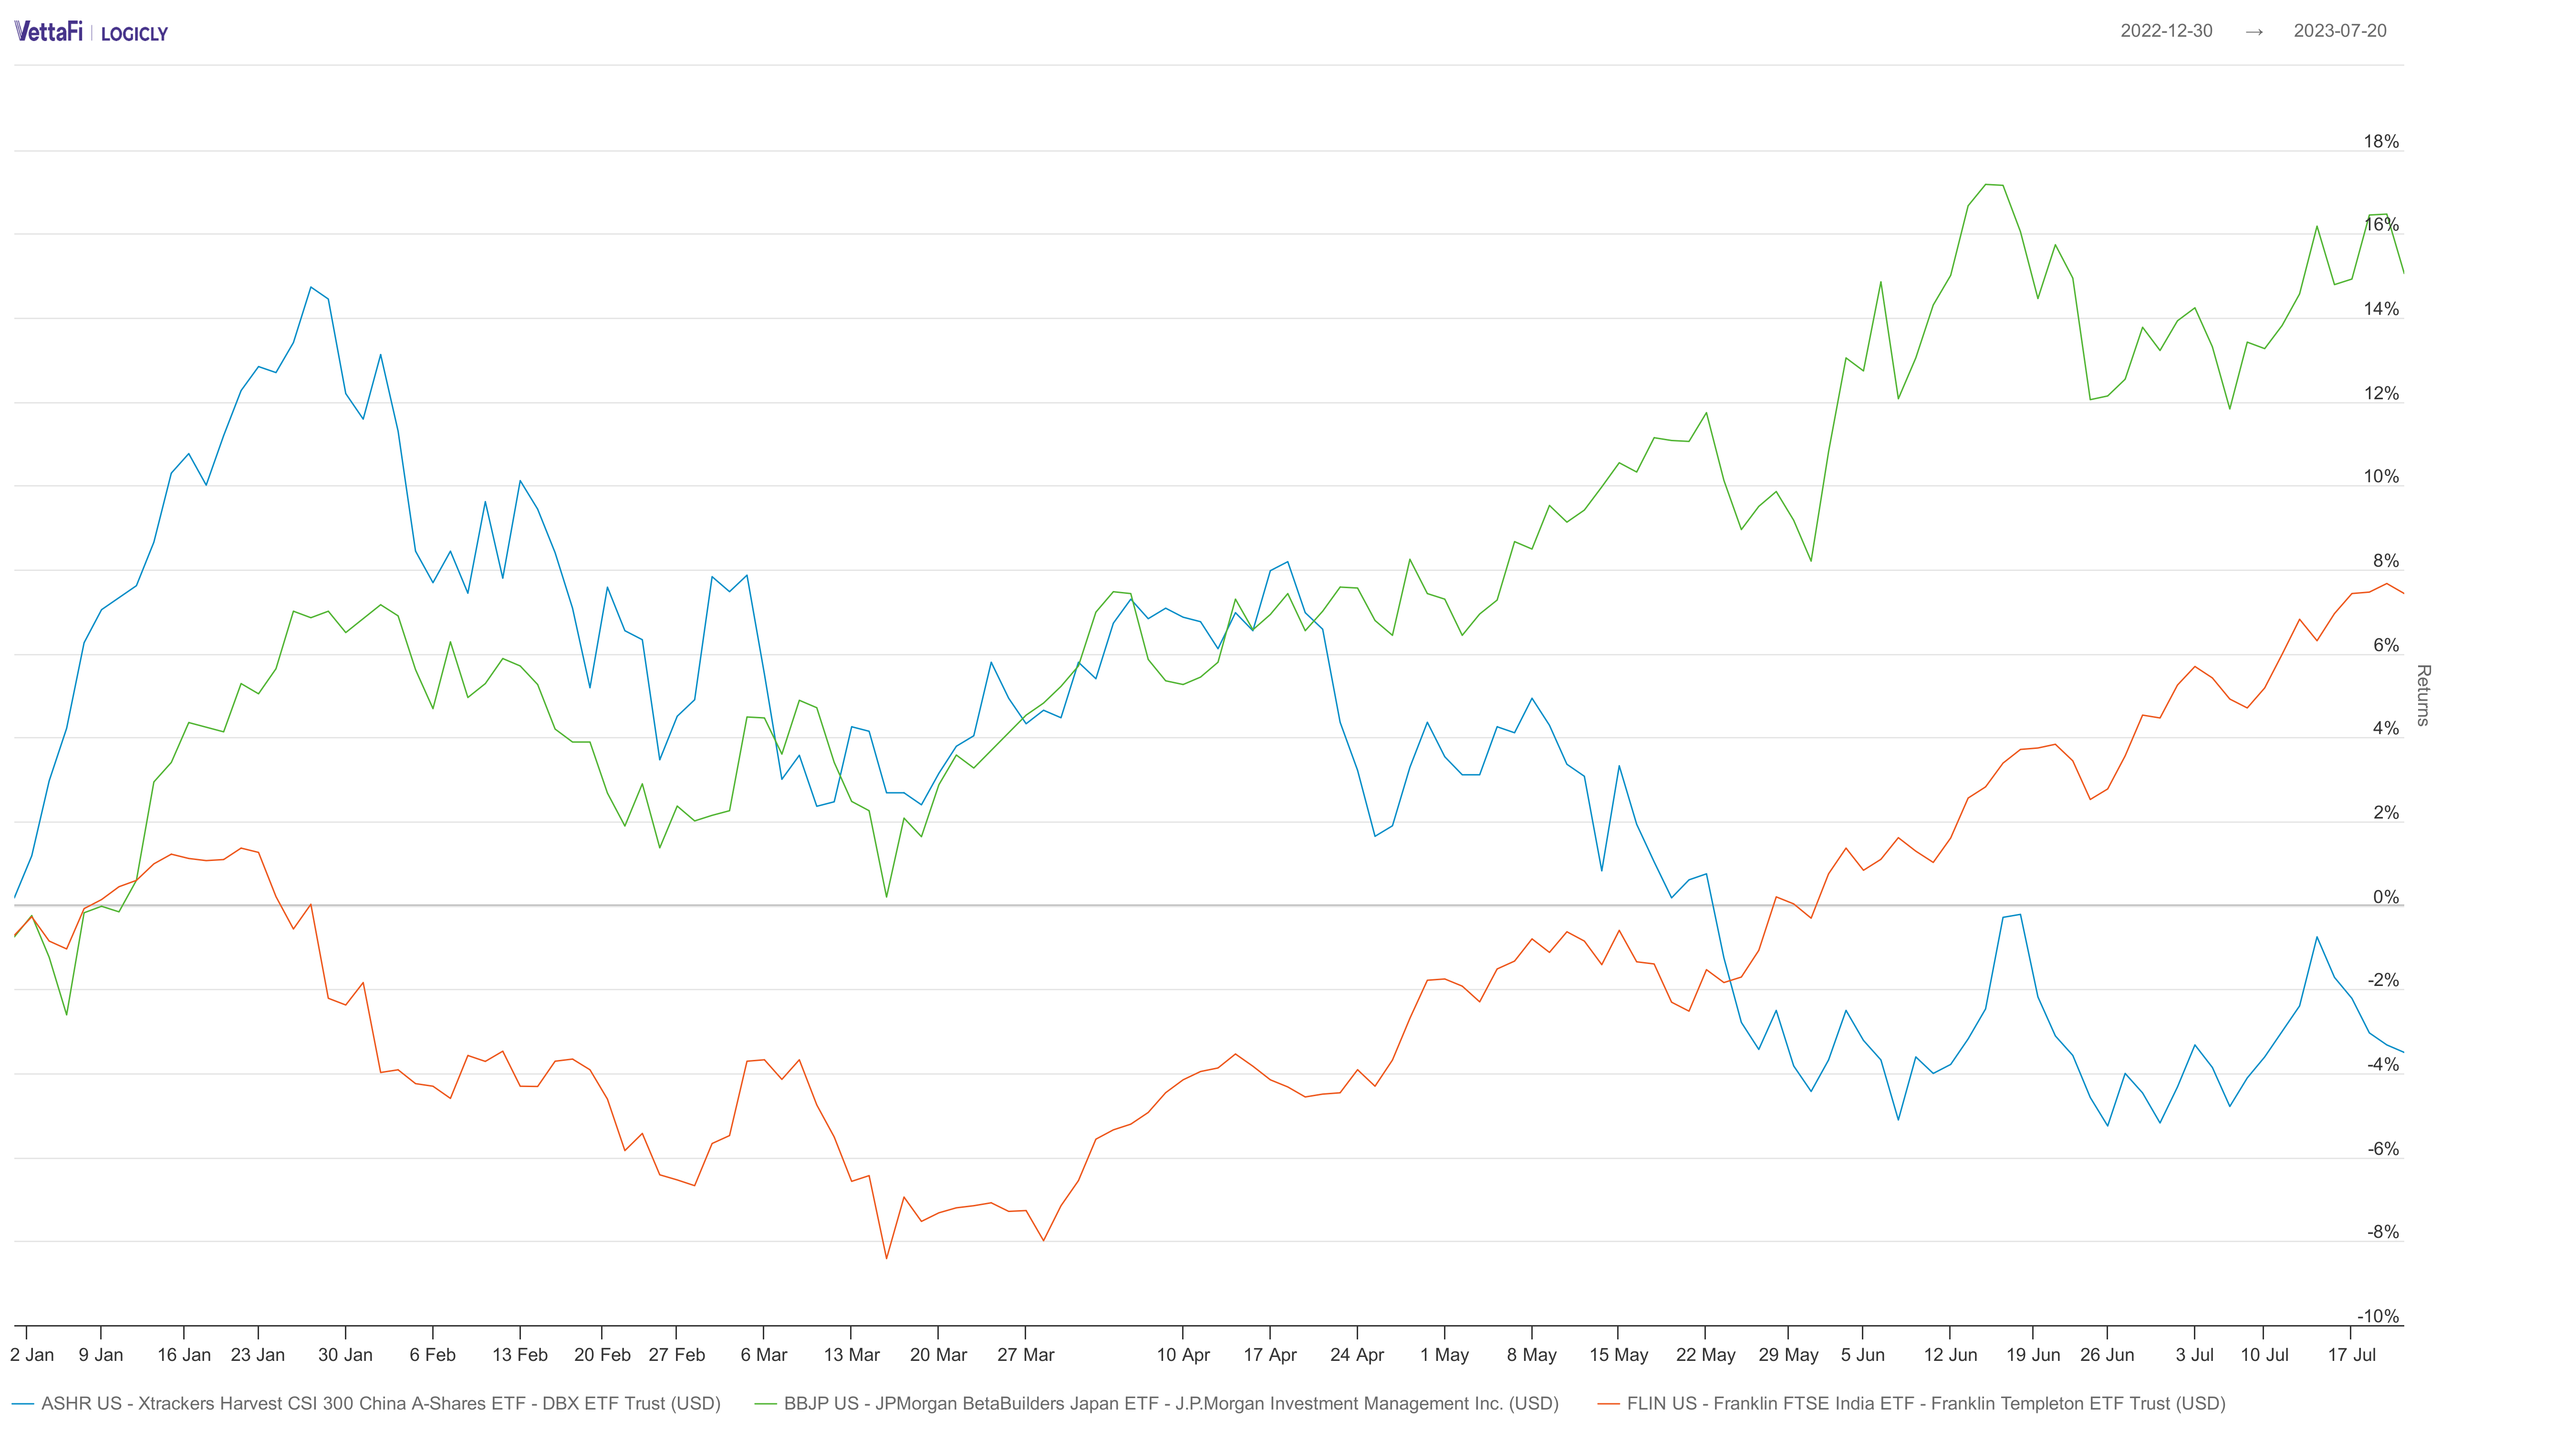
ASHR, FLIN, and BBJP YTD performance, per LOGICLY. Click to enlarge.
While iShares has dominated the single-country ETF space since it launched the first ones back in the 1990s, there are still other funds out there that offer similar exposures to each of these countries. The funds covering each respective market that have the second-highest year-to-date inflows include the Xtrackers Harvest CSI 300 China A-Shares ETF (ASHR), the Franklin FTSE India ETF (FLIN), and the JPMorgan BetaBuilders Japan ETF (BBJP).
ASHR was the first ETF to deliver access to China’s A-shares market, which was difficult for people outside of China to invest in. While it has underperformed MCHI slightly with a decline of 3.5%, it has pulled in nearly $400 million in assets so far this year. Further, the fund’s slightly different focus may appeal to investors who have an interest in the A-shares market specifically. The concentration on A-shares also results in some significant differences in sector allocation between the two funds.
FLIN, meanwhile, offers broader exposure than INDA, with almost twice as many holdings in its portfolio. The fund is up more than its larger rival, with a year-to-date gain of 8.44%. It has pulled in nearly $250 million in assets in 2023, and has a total of $328.9 million under management. FLIN also is significantly cheaper than INDA, charging less than one-third of INDA’s expense ratio at 0.19%.
BBJP is up 17.35% so far this year, more than EWJ. It also added more than $1 billion in new investment dollars during the same period. The fund is very similar to EWJ and has a similar number of securities, with the same companies included among its top 10 holdings, though at slightly different weights. However, like FLIN, it is significantly cheaper than its iShares-issued rival, with an expense ratio of 0.19%.
Looking Beyond the Largest ETFs
Although the iShares single-country ETFs have the longest track records and are generally the largest funds representing any given country, there are viable alternatives to them. Whether it is a fund like ASHR that offers a different angle on a particular market, or funds like FLIN and BBJP that offer similar exposures at lower costs, investors may find that they offer a more useful alternative that aligns better with their portfolio goals.
Visualizations and data provided by LOGICLY, which is a wholly owned subsidiary of VettaFi.
For more news, information, and analysis, visit VettaFi | ETF Trends.
