
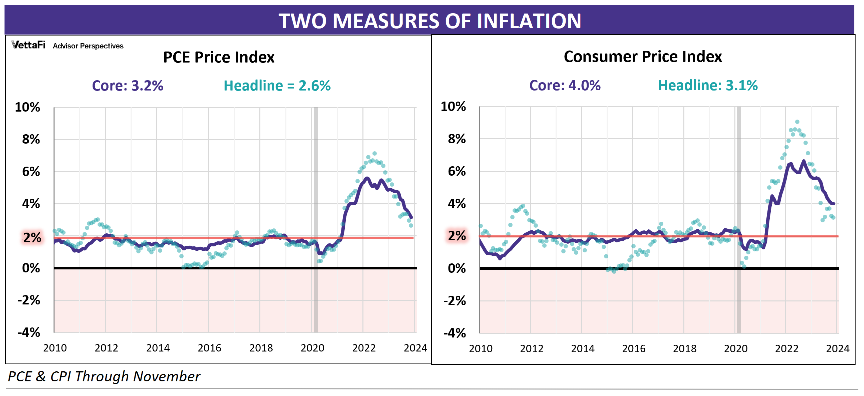
The BEA’s core Personal Consumption Expenditures (PCE) Price Index for November shows that core inflation continues to be above the Federal Reserve’s 2% long-term target at 3.2%. The November core Consumer Price Index (CPI) release was higher, at 4.0%. The Fed is on record as using core PCE data as its primary inflation gauge. For a closer look at each of those releases, check out our latest Consumer Price Index and PCE Price Index releases.
Preferred Inflation Gauge
The Fed is on record as using core PCE data as its primary inflation gauge.
“The inflation rate over the longer run is primarily determined by monetary policy, and hence the Committee has the ability to specify a longer-run goal for inflation. The Committee judges that inflation at the rate of 2 percent, as measured by the annual change in the price index for personal consumption expenditures, is most consistent over the longer run with the Federal Reserve’s statutory mandate. Communicating this inflation goal clearly to the public helps keep longer-term inflation expectations firmly anchored, thereby fostering price stability and moderate long-term interest rates and enhancing the Committee’s ability to promote maximum employment in the face of significant economic disturbances. [Source] Note: bolding added.”
Elsewhere, the Fed stressed the importance of longer-term inflation patterns, the likelihood of persistence, and the importance of “core” inflation (less food and energy). Why the emphasis on core inflation? Here is an excerpt from one of the Fed FAQs.
“Finally, policymakers examine a variety of “core” inflation measures to help identify inflation trends. The most common type of core inflation measures excludes items that tend to go up and down in price dramatically or often, like food and energy items. For those items, a large price change in one period does not necessarily tend to be followed by another large change in the same direction in the following period. Although food and energy make up an important part of the budget for most households — and policymakers ultimately seek to stabilize overall consumer prices — core inflation measures that leave out items with volatile prices can be useful in assessing inflation trends. [Source]”
PCE and CPI: A side-by-side comparison
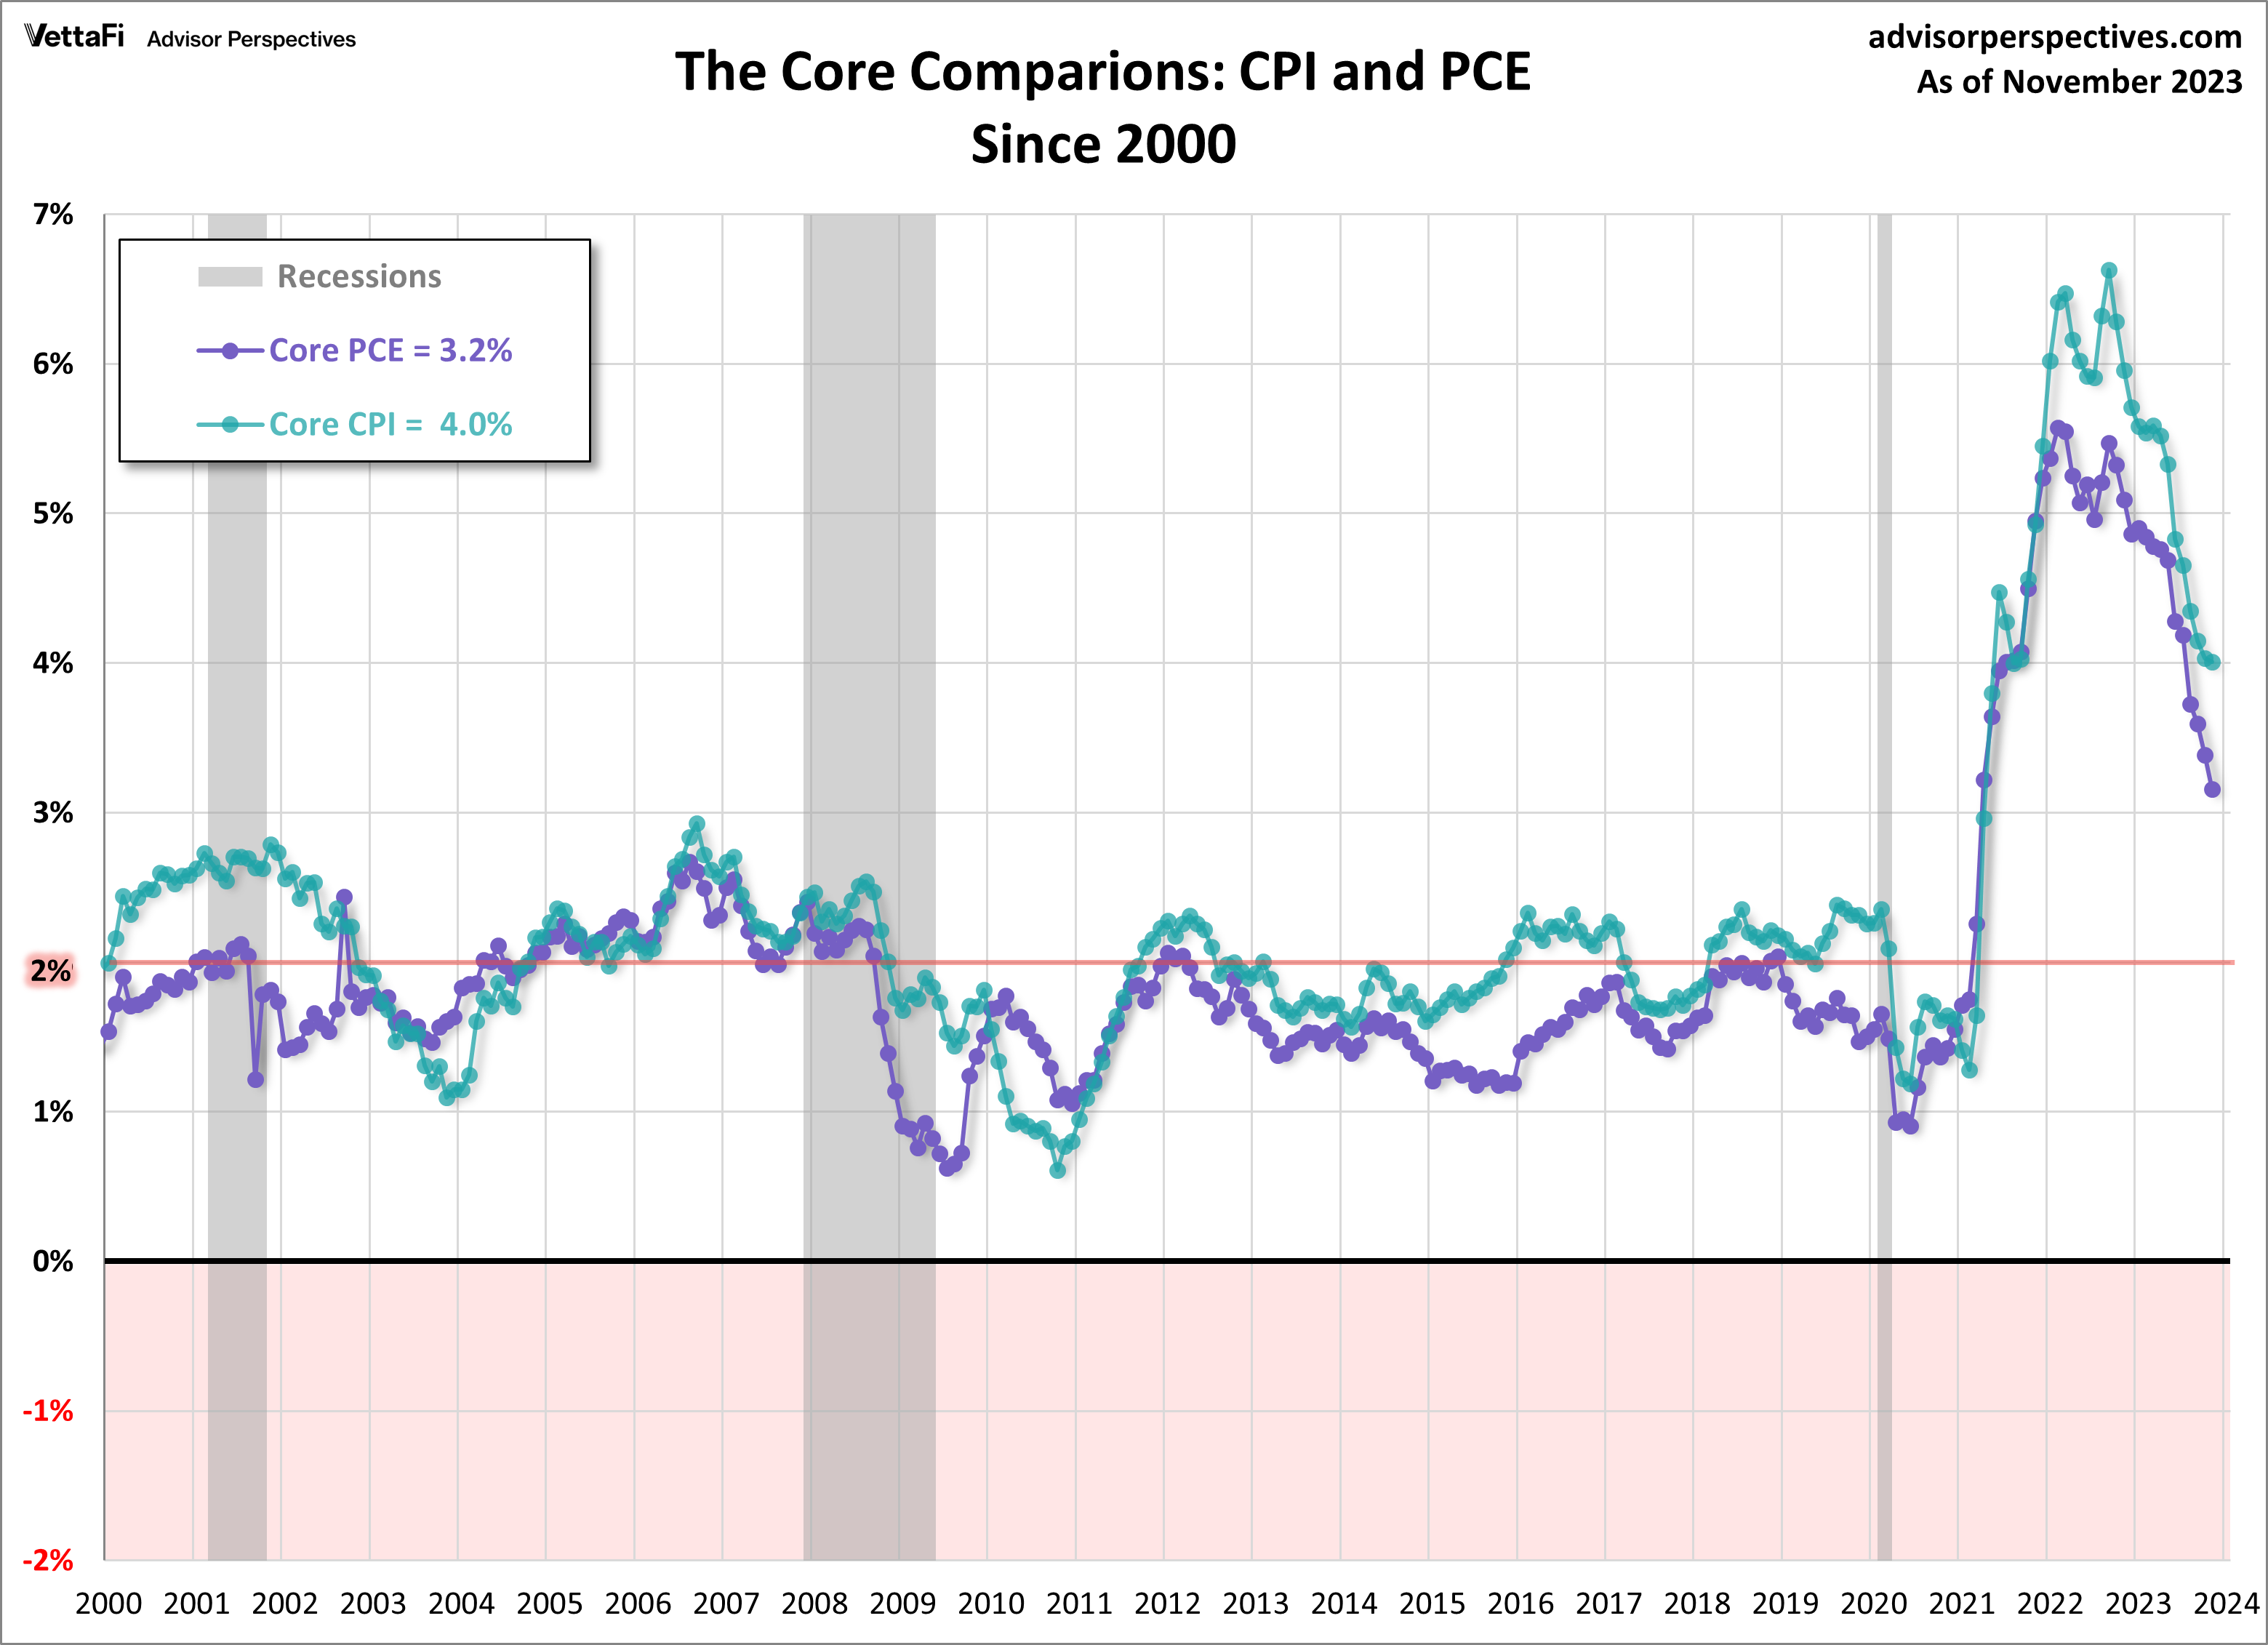
This close-up comparison gives us clues as to why the Federal Reserve prefers core PCE over core CPI as an indicator of its success in managing inflation. It is because core PCE is considerably less volatile than CPI. Given the Fed’s twin mandates of price stability and maximizing employment, it’s not surprising that, in the past, the less volatile core PCE has been its metric of choice. The disinflationary trend in core PCE (prior to 2022) casts doubt on the effectiveness of the Fed’s monetary policy.
The Bureau of Labor Statistic’s Consumer Price Index and the Bureau of Economic Analysis’s monthly Personal Income and Outlays report are the main indicators for price trends in the U.S. The chart below is an overlay of core CPI and core PCE since 2000.
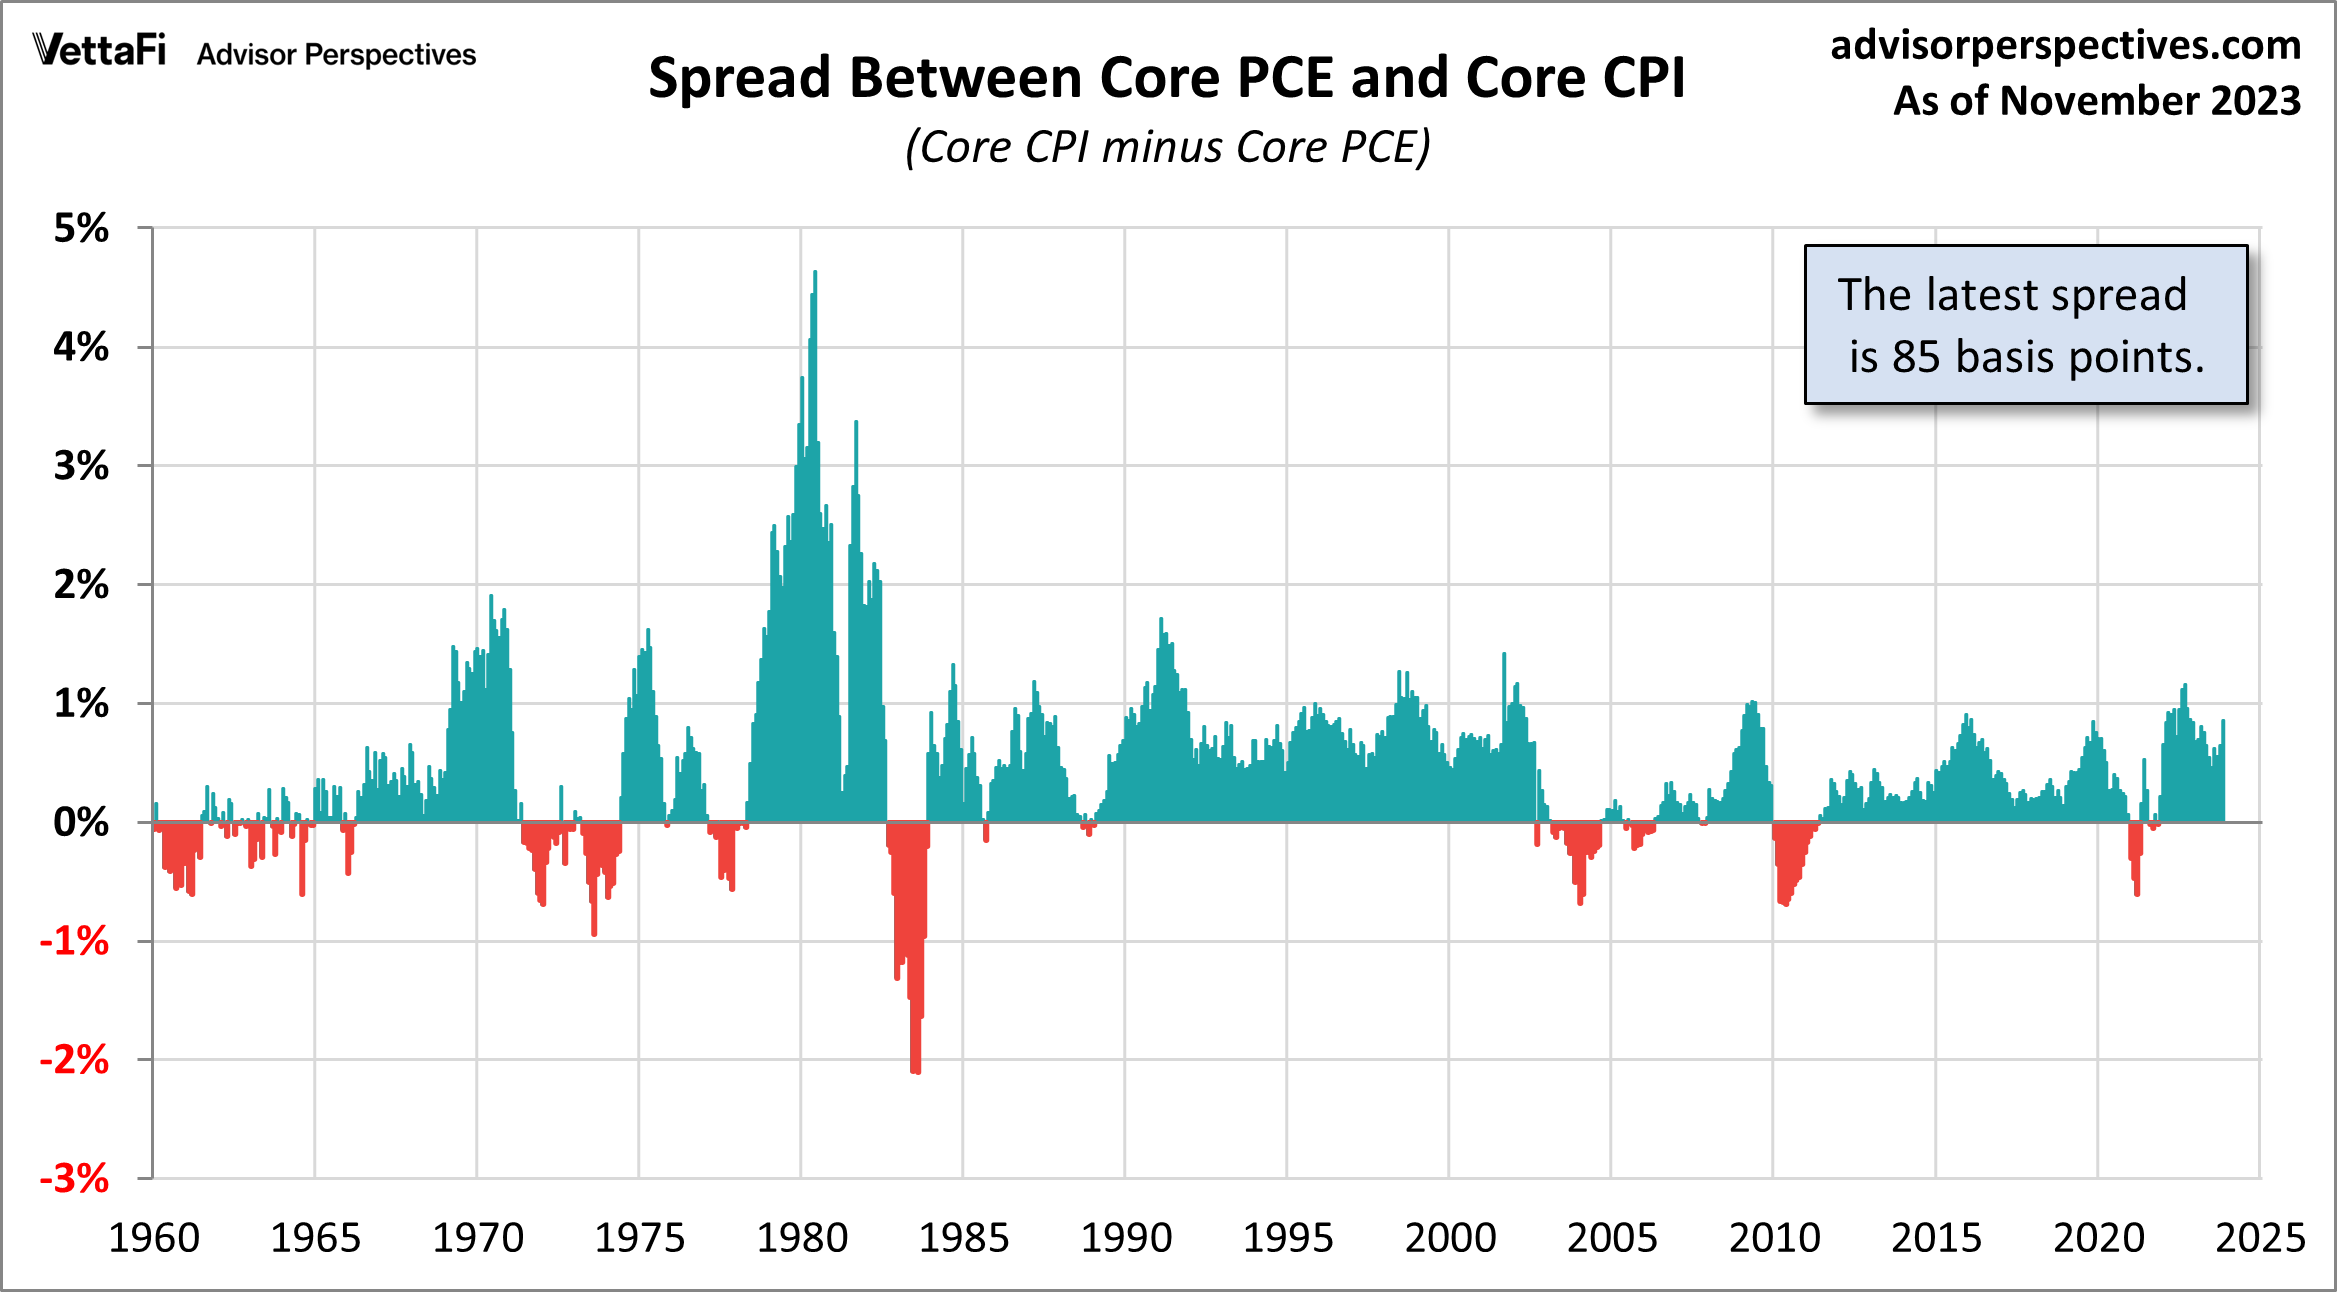
Here is an illustration of the spread between the two core metrics since 1960 through the latest month when both indicators have been published.
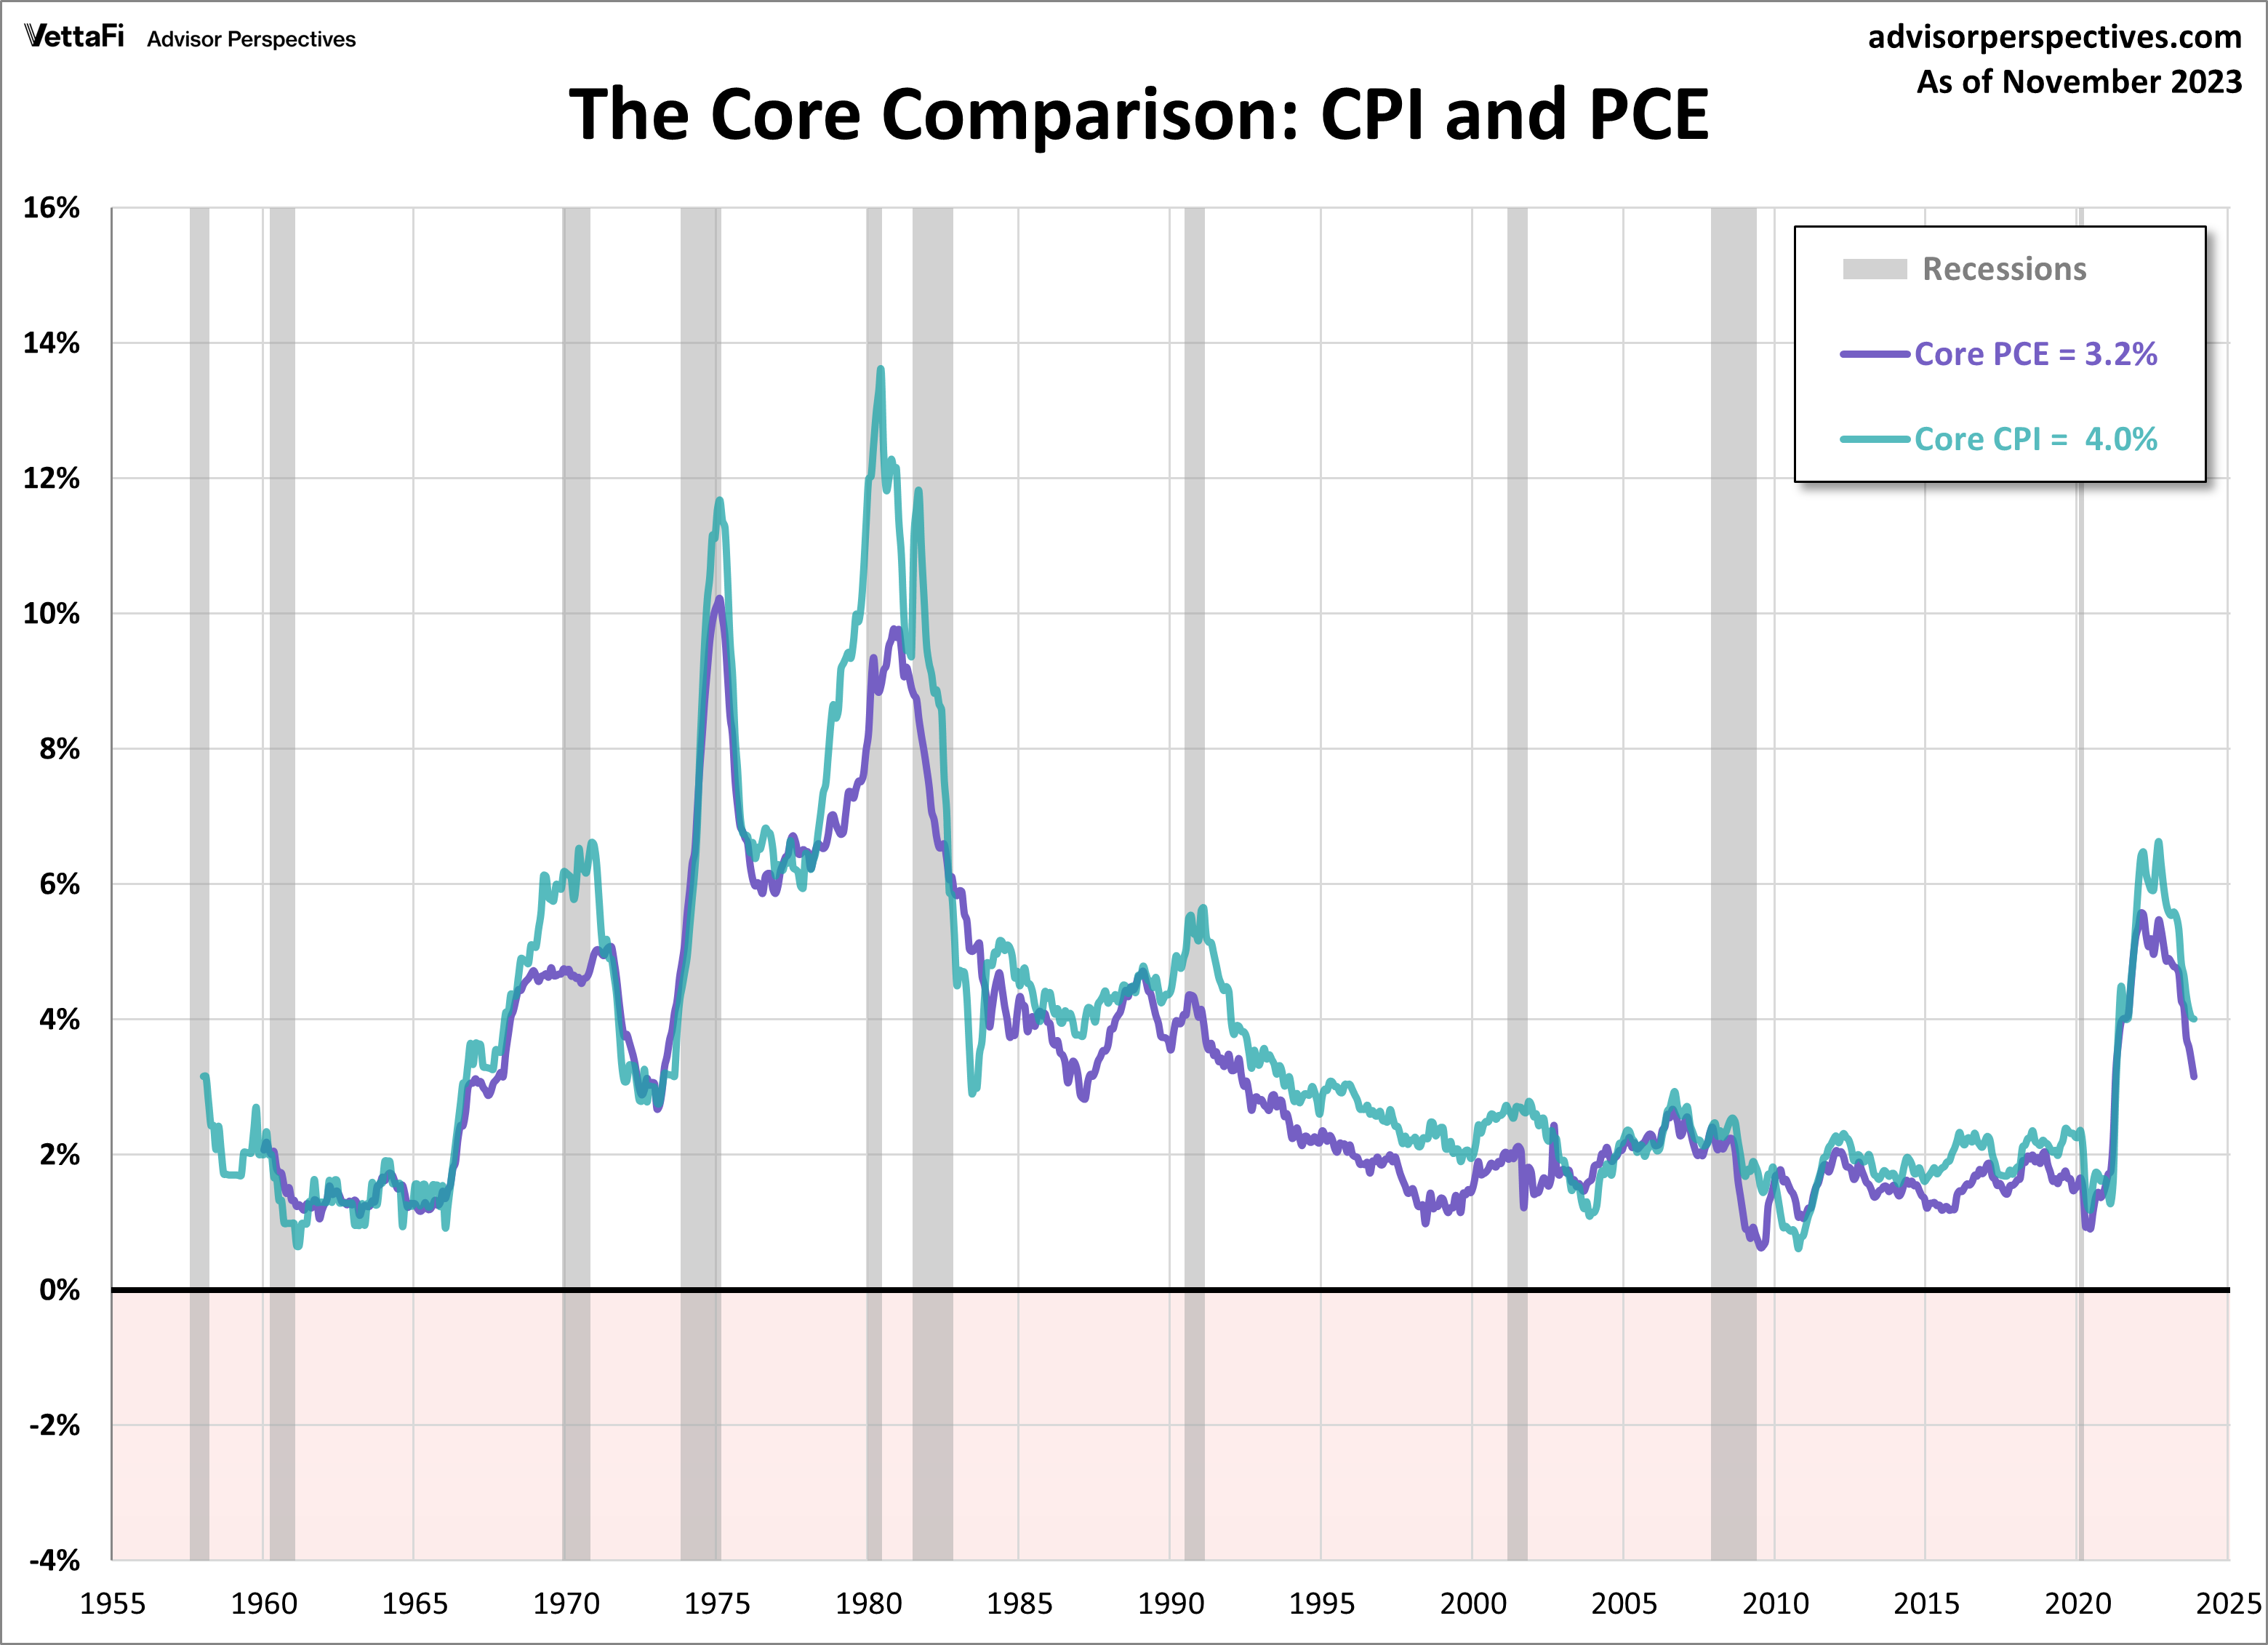
And here is a long-term perspective from the actual beginnings of the two series.
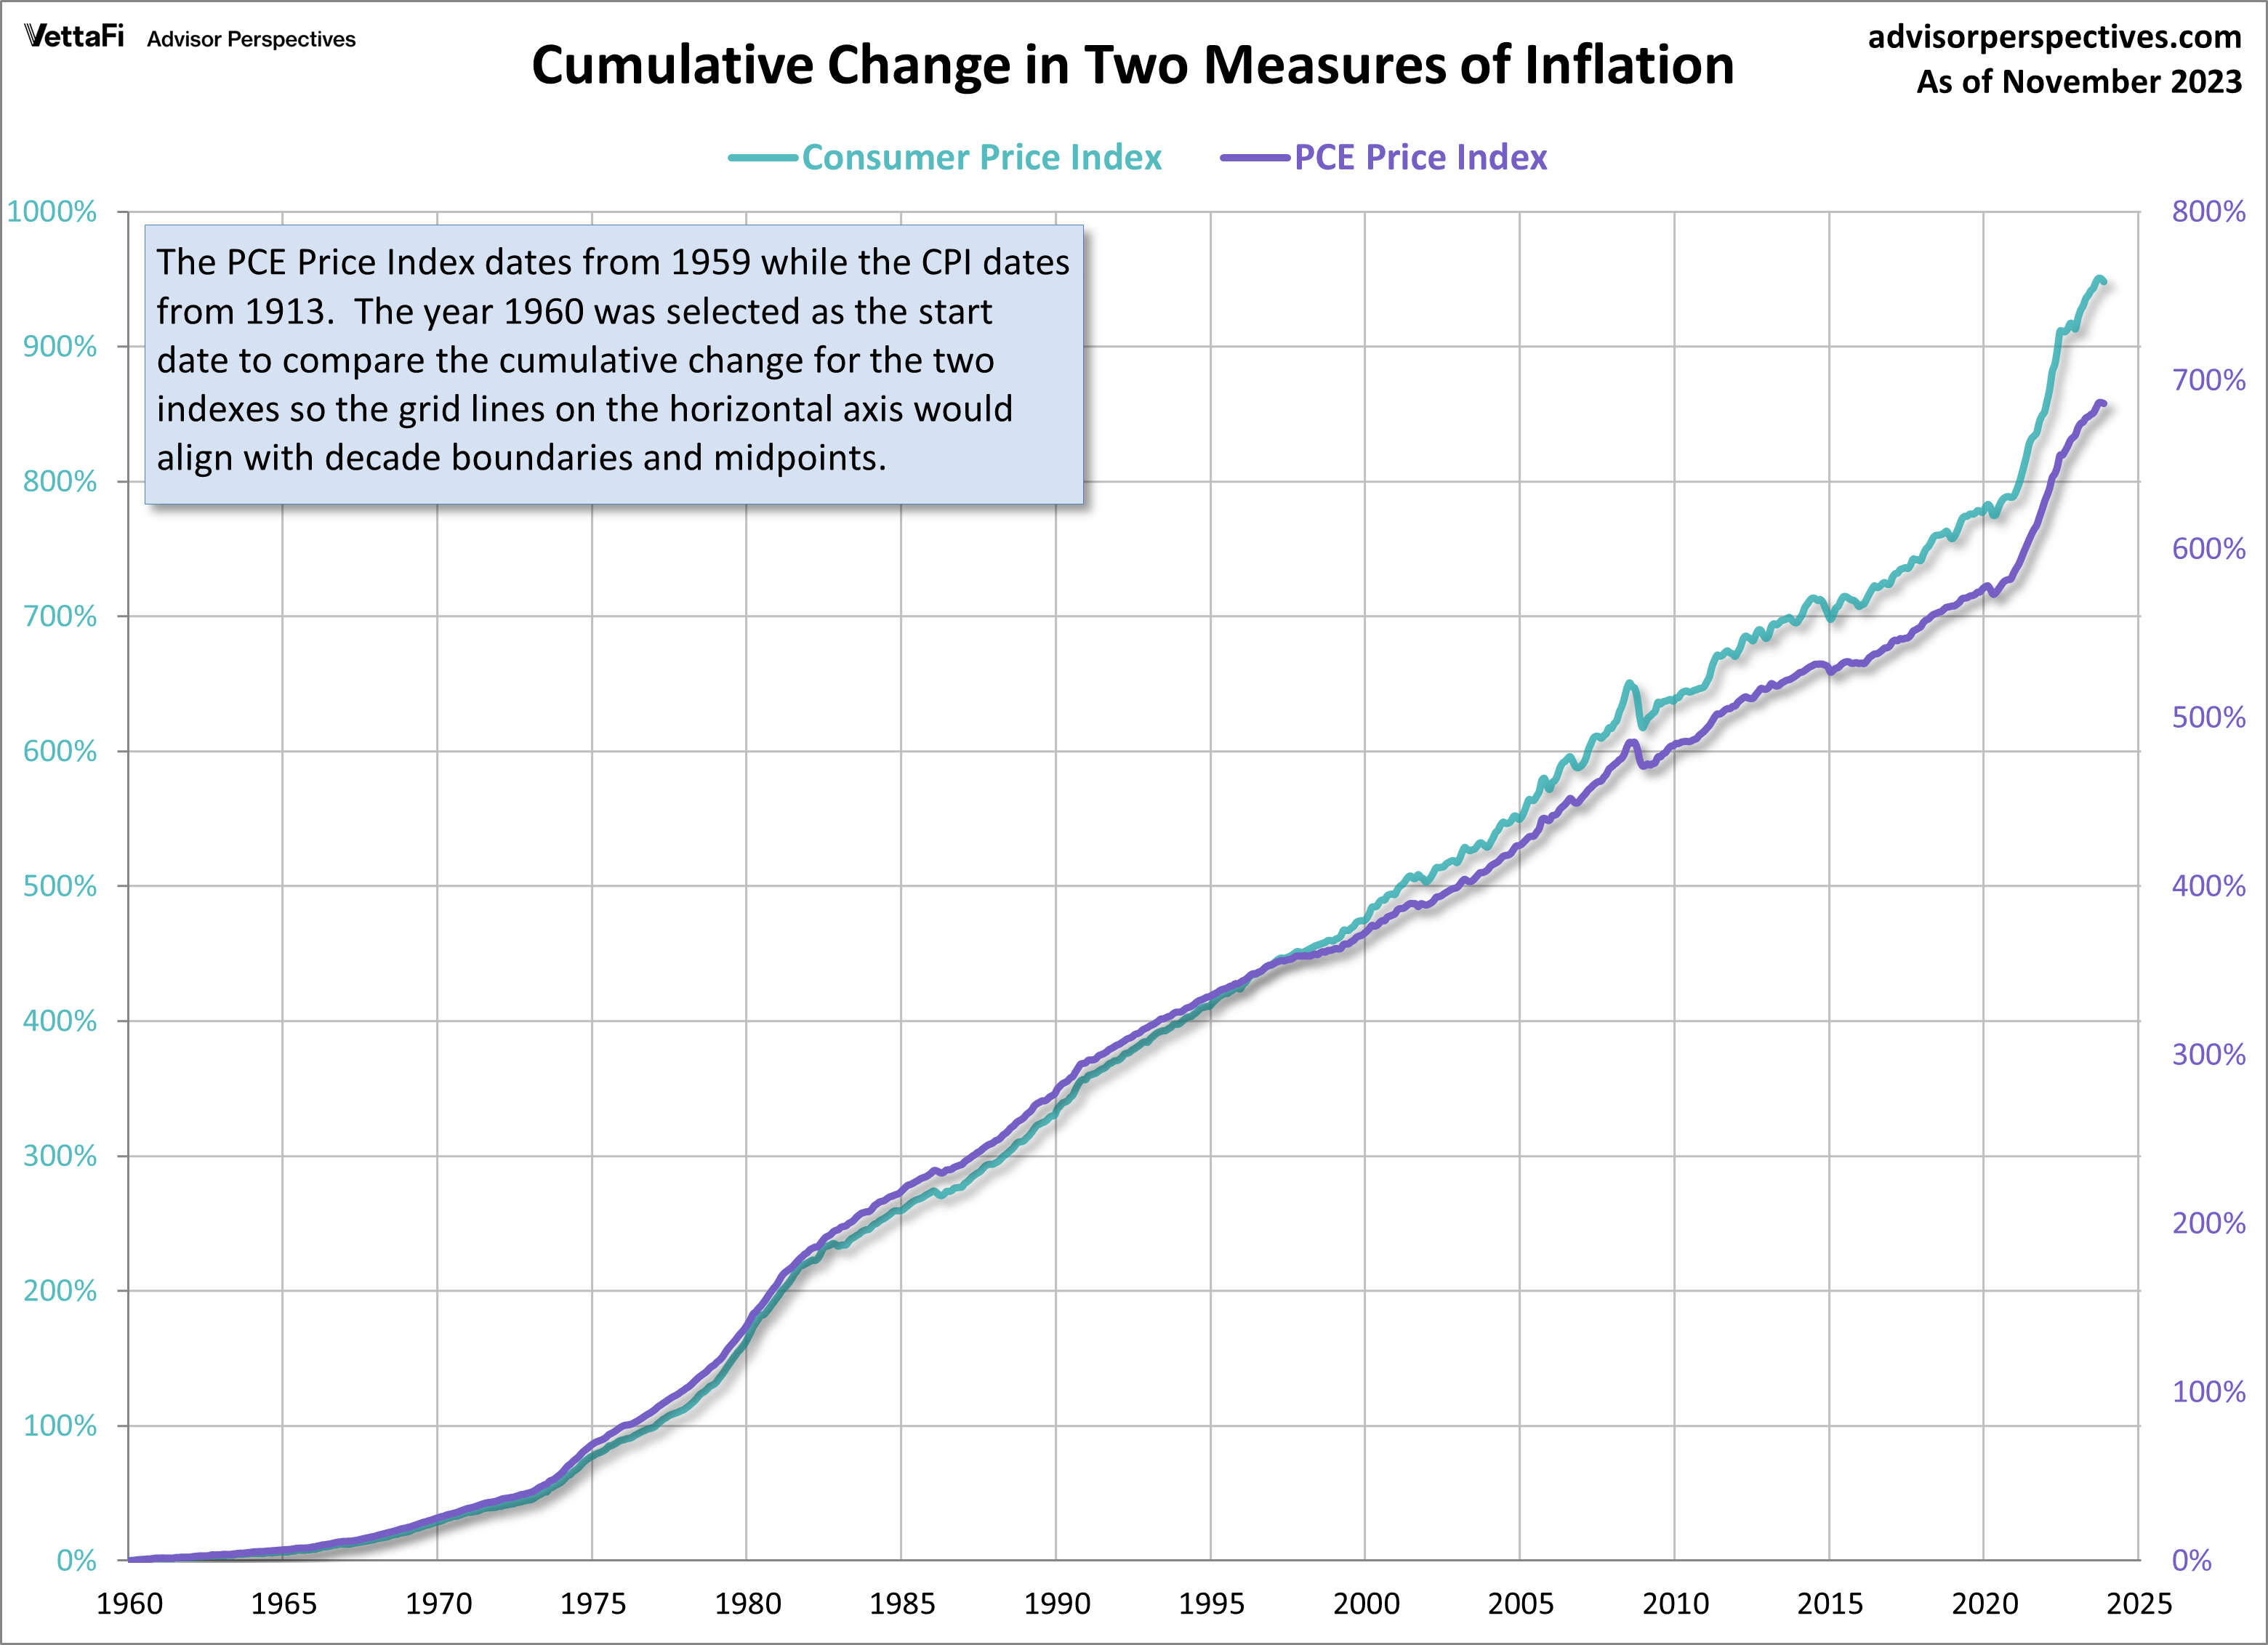
Here is a chart that helps us compare the cumulative change in the two indexes since 1960. Note that the CPI is reflected on the left axis while the PCE is reflected on the right axis. Over time, the PCE price index indicates significantly lower growth in inflation than does CPI.
For some technical data explaining the differences between the calculation of PCE and CPI, see this comparison article from the BEA.
We can’t exclude food and energy from our monthly expenses. But the extreme volatility of these two expense categories, especially energy, often obscures the underlying trend. And that is the focus of the chart above. For evidence of the volatility, see this overlay of headline and core CPI and this one of headline and core PCE.
Hostility Toward Government Inflation Analysis
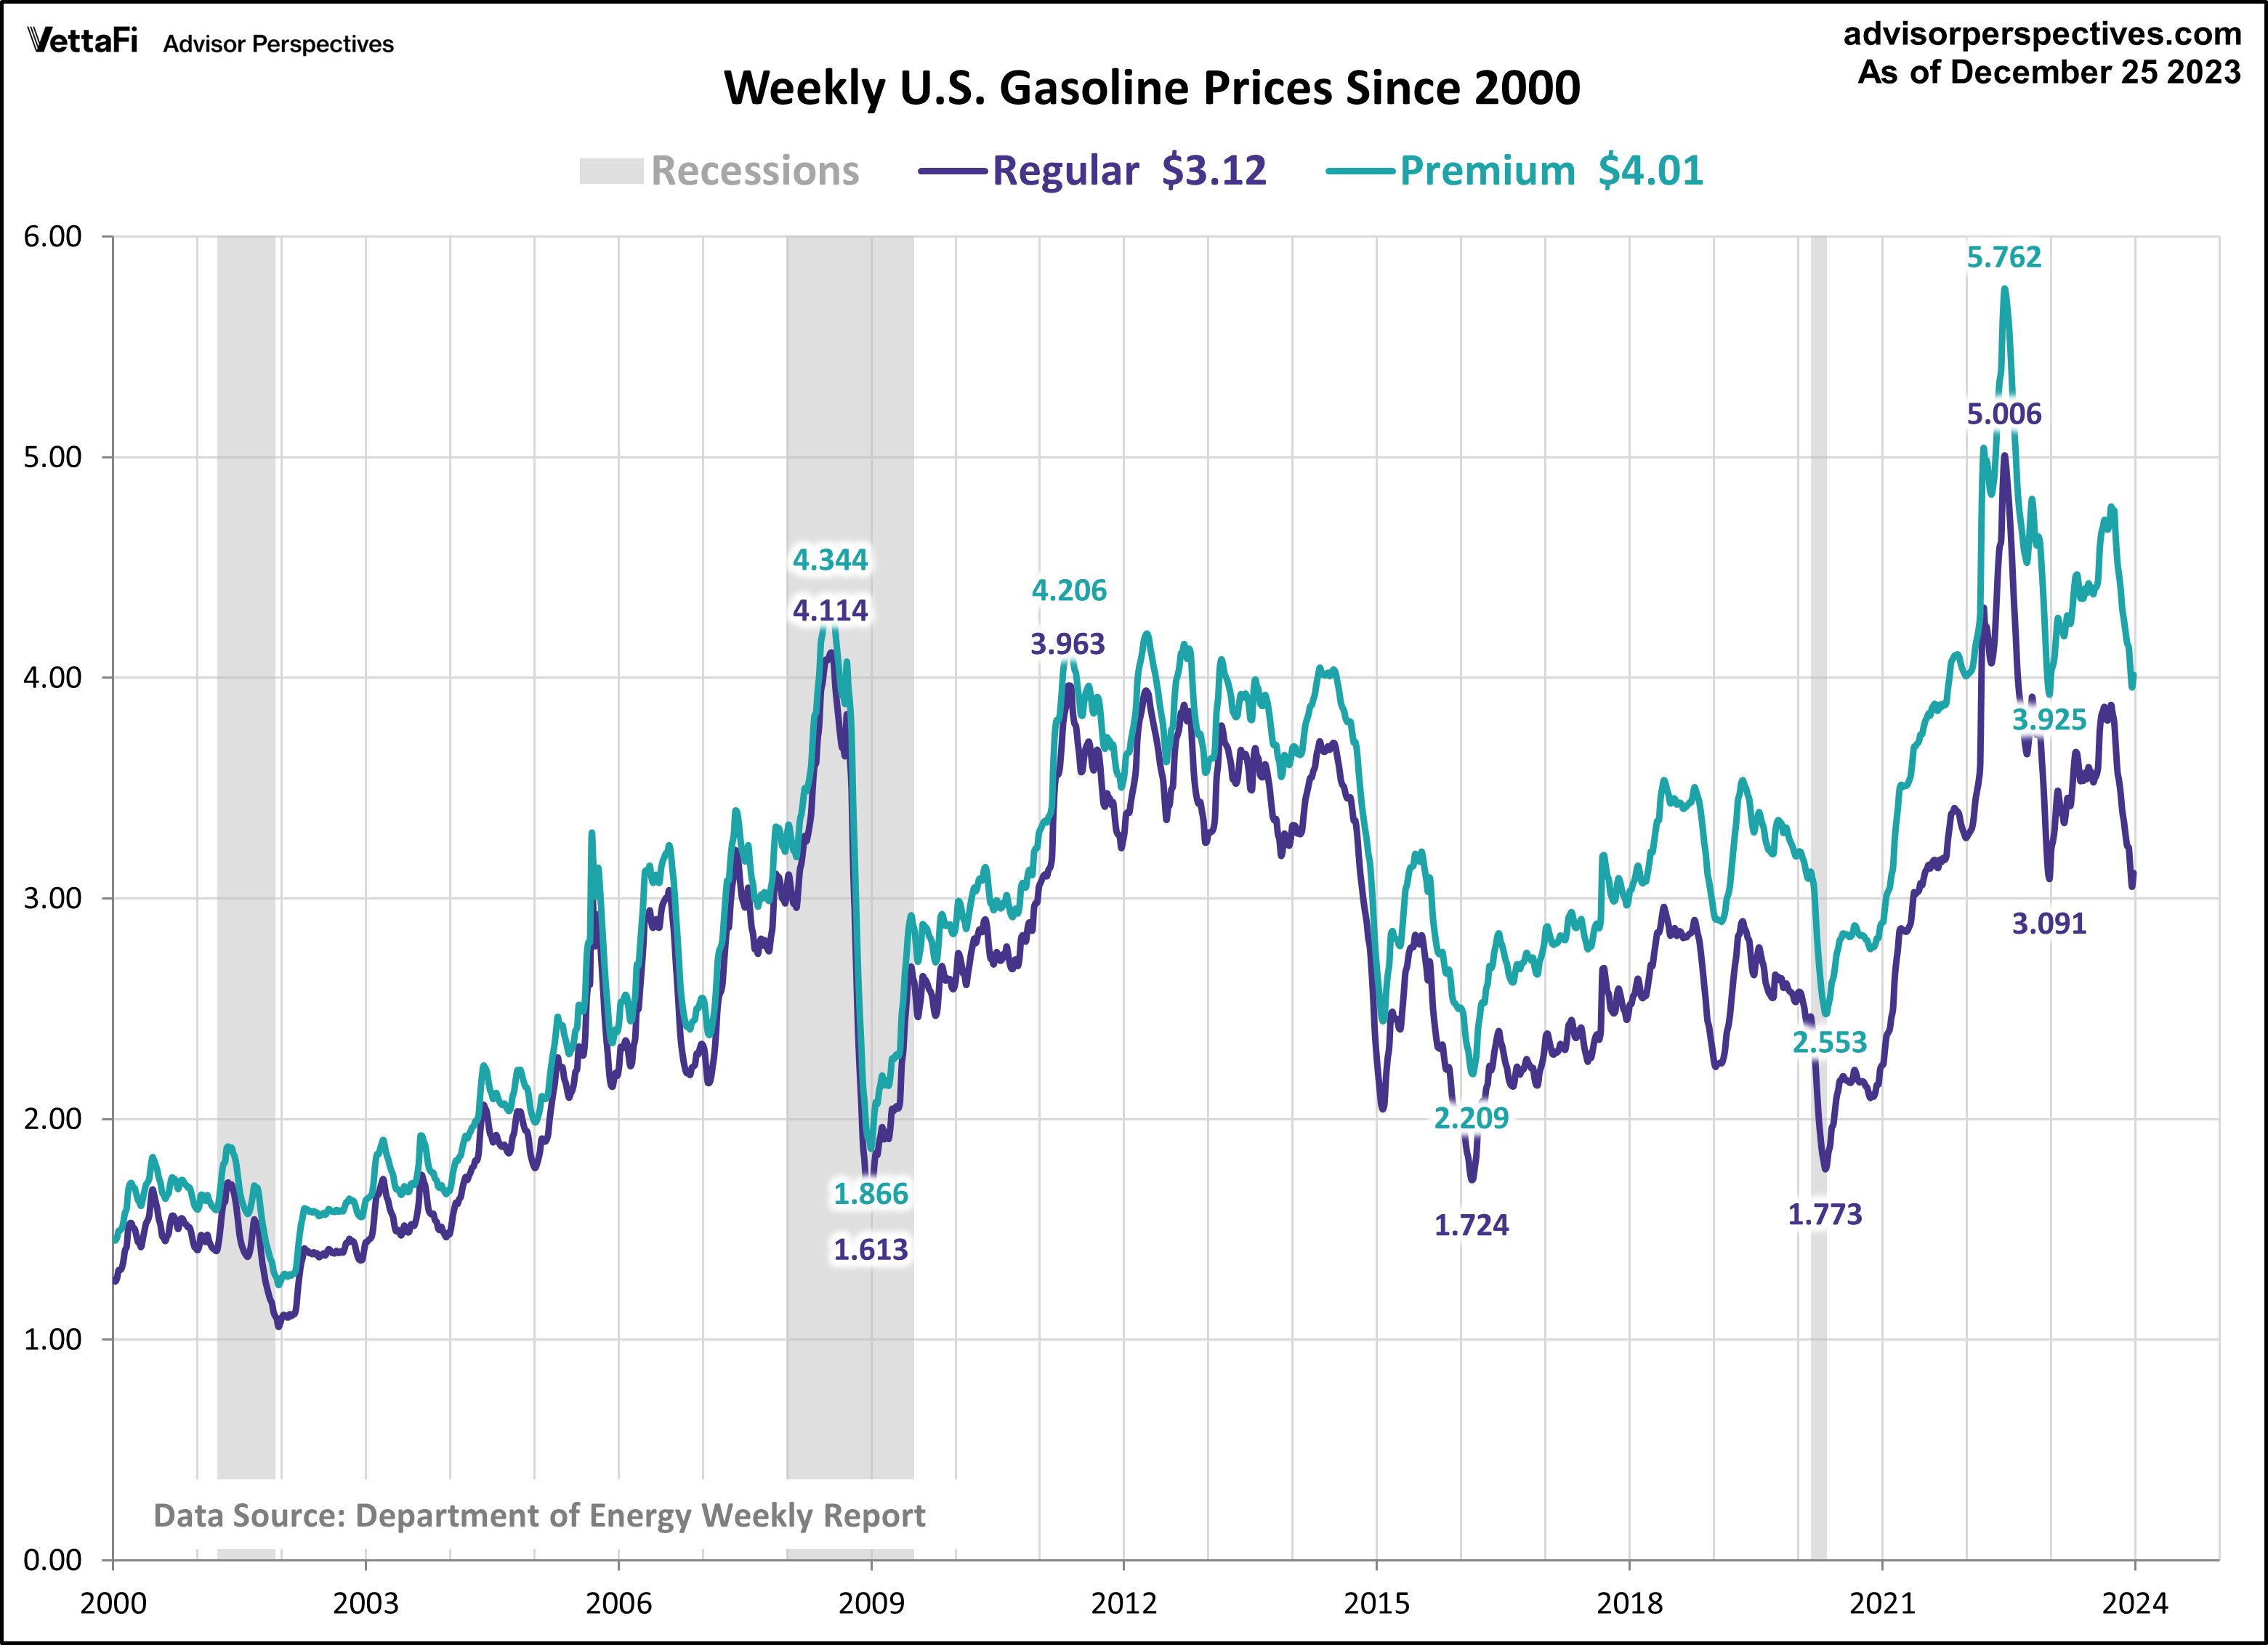
Gasoline price volatility explains why many people are confused by the exclusion of food and energy from core measures of inflation. The chart of gasoline prices below is based on the latest weekly data from the Energy Information Administration.
During inflationary times, investors sometimes turn to agricultural commodity ETFs such as Teucrium Wheat Fund (WEAT) and Teucrium Corn Fund (CORN).
For more news, information, and analysis, visit the Commodities Channel.
