

By Art Huprich, CMT®, Chief Market Technician, Day Hagan Asset Management
SUMMARY
Last week’s tape reflects a market that has stabilized, has established a bottom for decimated growth stocks, and is starting a short-term uptrend. Was last week the bottom for growth and market indices? We won’t know until after the fact.
MOMENTUM, BREADTH PARTICIPATION
The Fed, supply chain constraints, commodities, Ukraine/Russia, inflation, and Omicron ba.2 are a real “wall of worry,” which anecdotally is supportive of equities. Regardless, last week’s tape action was eye-popping in terms of momentum and breadth participation/thrusts—bullish confirmation.
-
Momentum: Four consecutive days in which the S&P 500 (SPX) closed higher by at least 1% and NASDAQ rallied over 8%—the best week for both indices since November 20.
-
McClellan Oscillator: Normally used to measure overbought (OB) and oversold (OS) conditions. However, the oscillator recently moved from a relatively OS condition in early March to a very OB condition last Friday. Since the late-2018 low, this type of reading has occurred seven times. Each time the SPX was higher—momentum. Friday was number eight. Please reach out for the chart.
-
Breadth participation/thrusts: According to Ned Davis Research (NDR), Friday’s rally pushed over 90% of stocks in the SPX above their 10-day MA and a Zweig Thrust occurred (common stocks only). According to NDR, “while past performance does not guarantee future results, breadth thrusts have been amongst the most consistent indicators since the financial crisis.” Please reach out for the chart.
-
S&P 500 completed a short-term upside base building pattern, moving above a previous price peak and establishing a short-term uptrend. Figure 1.
-
To add credence to last week’s tape action, the equity markets need to record upside follow-through this week—a critical week indeed.
I am still of the opinion that equity markets will continue to experience day-to-day and week-to-week price volatility in both directions. As my friend, well-seasoned analyst Helene Meisler, reminds us, “Nothing like price to change sentiment.” Therefore, I believe sentiment extremes will continue to drive short-term price movement.
SUPPORT BELOW, RESISTANCE ABOVE
Short-term downtrend lines have been violated to the upside. However, plenty of overhanging selling pressure (resistance) exists. Working through the amount of existing overhanging selling pressure (resistance) is not a quick fix. It takes time and effort—volatility.

Figure 1: S&P 500 Large Cap Index. | Levels of selling pressure (resistance) and underlying support levels are clearly depicted below. Please reach out for any specifics.
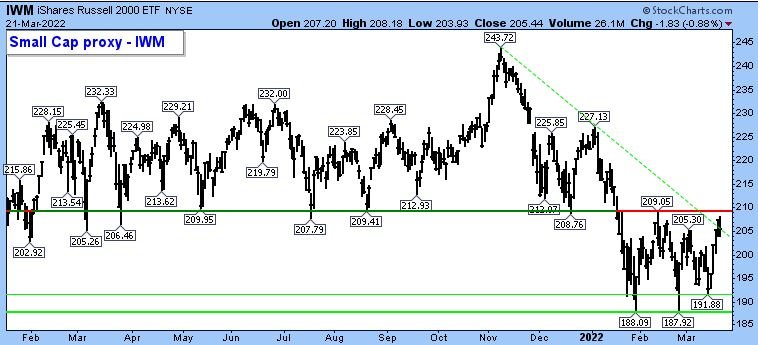
Figure 2: iShares Russell 2000 – Small Cap proxy. | This chart is getting very interesting. A serious short squeeze could happen under the right conditions—a high volume breakout that is met with skepticism. Price labels, red resistance lines, and green support lines depict areas of resistance and support.
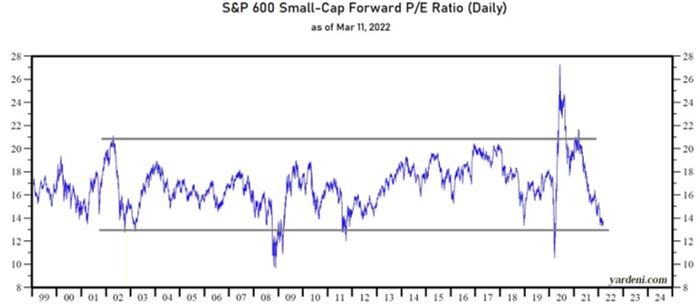
Figure 3: S&P 600 Small-Cap Forward P/E Ratio. | This chart is for those who favor Small Caps and fundamentals.
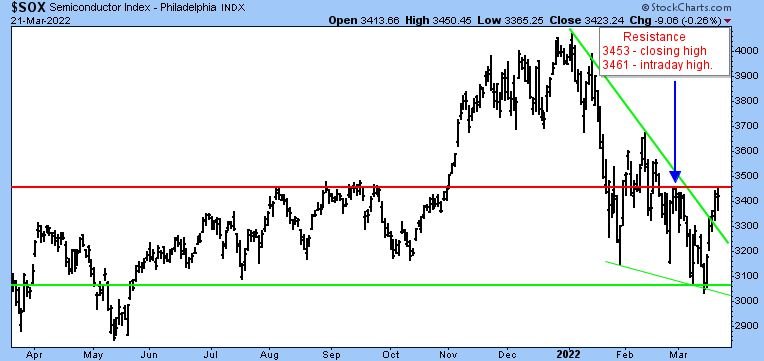
Figure 4: Semiconductor Index – SOX. | An old friend and former colleague (RIP Big Guy) believed the semis were a leading indicator for the NASDAQ. While that may not be as true now as it was during his time, there is still credence to his statement. Let’s test his theory and see if the SOX can break out and pull NASDAQ with it. Please don’t anticipate but instead be reactive if the breakout occurs.
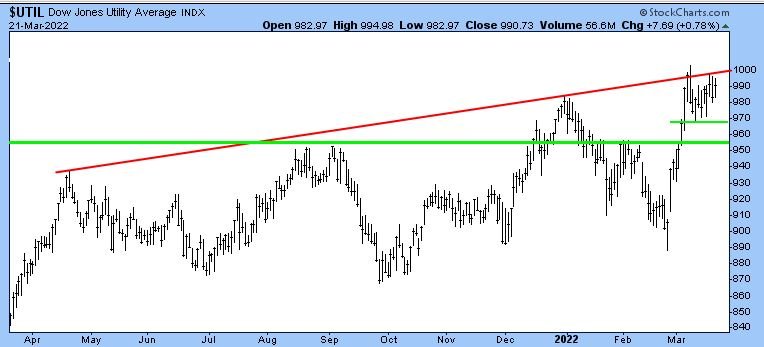
Figure 5: Dow Jones Utility Average – UTIL. | Is this chart a short-term guidepost for the fixed income market? As it is right at resistance, with a huge interest rate move higher yesterday (Fed Chairman Powell’s hawkish comments) after having already experienced a strong topside move, I’d say yes. A pullback here by UTIL may equate to a short-term pullback in interest rates and a tactical rally (short-term only) by the fixed income market. Ultimately, however, I believe UTIL resolves higher.
Day Hagan Asset Management appreciates being part of your business, either through our research efforts or investment strategies. Please let us know how we can further support you.
—Written 03.21.2022. Chart source: Stockcharts.com unless otherwise noted
PDF Copy of this Article: Day Hagan Tech Talk: Critical Week At Hand (pdf)
DISCLOSURE
Information on this website does not involve the rendering of personalized investment advice, and is not intended to give specific advice but is limited to the dissemination of general information on products and services. Information presented herein is subject to change without notice and should not be considered as a solicitation to buy or sell any security. This information may not be suitable for all investors. Carefully consider your investment objectives, risk factors, and charges and expenses before investing. Please remember that past performance may not be indicative of future results. Information pertaining to Day Hagan Asset Management, including fees and services, can be found in our Form ADV Part 2, a copy of which can be found by clicking here. The Donald L. Hagan Form CRS can be found by clicking here.
Investment advisory services offered through Donald L. Hagan, LLC, a SEC registered investment advisory firm.