
SUMMARY
Oil is a vital element for a properly functioning automobile. Similarly, Central Bank policy and the direction of interest rates is a vital element supporting a healthy, fully functioning domestic equity market.
BELLS, WHISTLES, AND BEEPING
Many times, when I am pulling out of the first-floor garage of our condominium, bells and whistles start going off on my dashboard. When I look to my right, my wife is usually distracted by her phone and forgot to latch her seat belt. Know what I mean? Or in decades past, with the children in the car, suddenly the “rear door open” symbol would pop up on my dashboard. Usually, my son, like his mother, was distracted. Birds of a feather — for which I will always be grateful. RIP PAH Jr., as we approach your birthday.
All of this is to say one of the most important lights that can pop up on one’s car dashboard is the little oil can light. We’ve all seen it. When the oil can light suddenly pops up what it really means is “check your engine.” If you want the vehicle to keep running in a healthy and proper fashion, action needs to be taken.
On Wall Street, since 2009, one of the main elements supporting a properly functioning and healthy equity market uptrend has been the stimulative policies enacted by Central Banks, including keeping interest rates low – the oil of Wall Street.
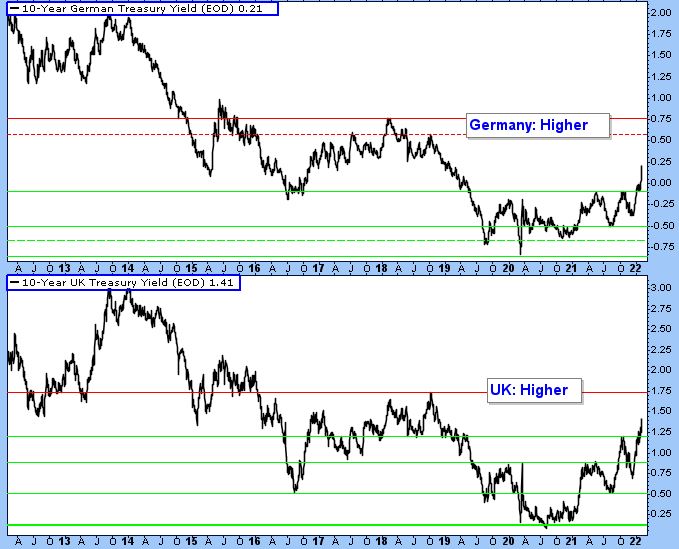
I mention this because various Wall Street strategists, analysts, prognosticators, and the news media are espousing how this chart and that chart are the most important to follow. Wall Street is at a juncture where the following chart (Figure 1), produced by Ned Davis Research, is as important as any we follow. Figure 1 depicts the percentage of Central Banks who last rate change was a decrease (lower frame). Figures 2 and 3 are a good visual of last week’s ramp higher by global 10-year yields.
Figure 1. MSCI All Countries World Index vs. Breadth of Central Bank (CB) Rate Changes. Most Central Banks are seeking to normalize monetary policy and interest rate policy (QE to QT). Global equities have underperformed when the percentage of CB’s decreasing policy rates (lower frame and performance box), has fallen below 50%. In other words, when the majority of Central Banks stop lowering rates, equity markets face headwinds.
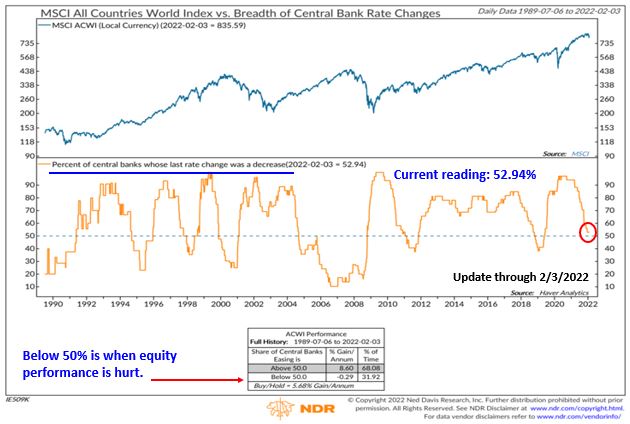
Figure 2. 10-Year Japan and 10-Year U.S. Treasury Yield. What is this chart saying about the recent, current, and future domestic equity markets rotation into value/cyclical from speculative/no earnings growth? Note the significant breakout in Japan’s 10-Year sovereign yield.
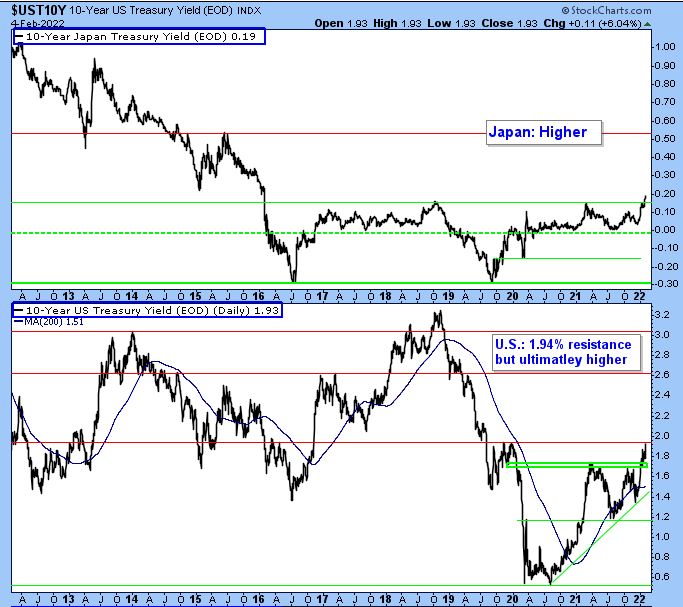
Figure 3. 10-Year German and 10-Year UK Sovereign Yield. As the current teenage population says, much to my irritation, “same.” I’ll simply say, “stair step higher.”
STIFF-ARMED AT RESISTANCE
Is the recent price-low and subsequent bottom formation more than just short-term? As stated last week, until we get a momentum surge, a breadth thrust(s), or significant internal improvement, it is short-term only. At this point, more work is needed to imply support is firmly in place. Plus, the NDR Catastrophic Stop Loss Model suggests caution unless a Breadth Thrust occurs, which would indicate strong demand (buying interest) and that important support has been established.
Figure 4: NYSE Advance Decline Line (all issues). Back to resistance and now the test!
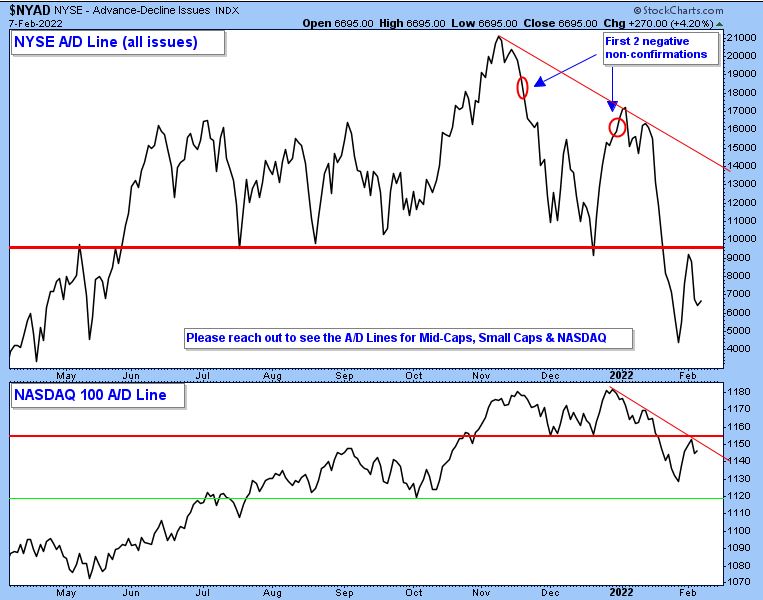
Figure 5: S&P 500 Large Cap Index (SPX – 60-minute chart). Sandwiched between support (green lines and previous price lows) and a lot of overhanging selling pressure (resistance – red lines and previous price peaks).
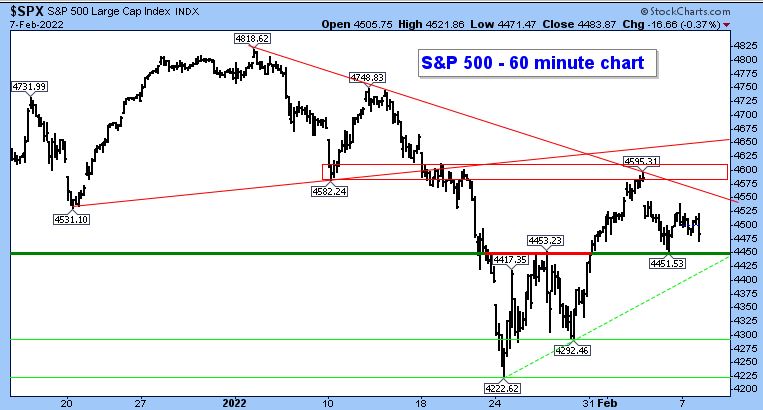
Figure 6: S&P 500 Large Cap Index (SPX – line chart). Areas of support (green lines and previous price lows) and areas of overhanging selling pressure (resistance – red lines and previous price peaks) are depicted.
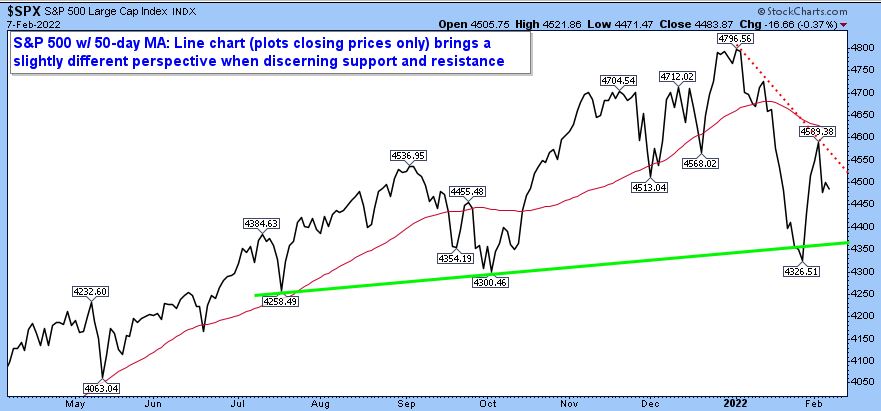
Figure 7: iShares Russell 2000 (IWM – small cap proxy). In terms of listing areas of support and resistance, not wanting to sound difficult, but it’s almost like “pick’em.” The very short-term thumbnail chart on the right suggests a move above $204 may bring a smile to the Bulls, trading-wise.
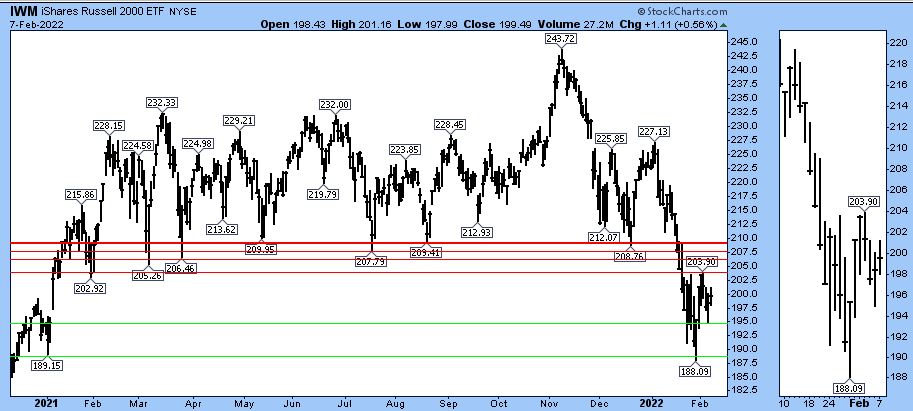
Figure 8: NASDAQ Composite (COMPQ). Similar to Figure 7, “pick’em.” A move above 14505 (see very short-term small thumbnail chart on right) might be a “positive” for the bulls, trading-wise. NASDAQ 100 (NDX) levels are shown in bottom of chart.
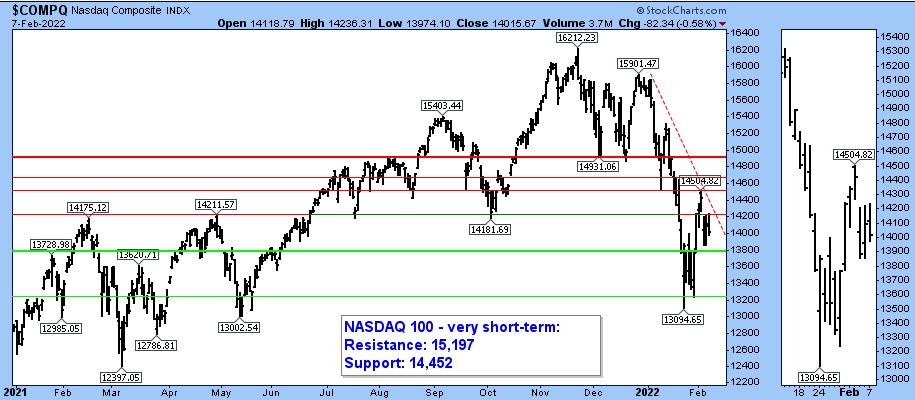
Figure 9: Dow Jones Industrial Average (DJIA – upper frame) and Dow Jones Transportation Index (TRAN – lower frame). | When viewing the regular chart and thumbnail chart (small chart on right), the various areas of support and resistance are clearly defined.
![]()
Day Hagan Asset Management appreciates being part of your business, either through our research efforts or investment strategies. Please let us know how we can further support you.
Art Huprich, CMT®
Chief Market Technician
Day Hagan Asset Management
—Written 02.07.2022. Chart source: Stockcharts.com unless otherwise noted.
Originally published by Day Hagan on February 8, 2022.
For more news, information, and strategy, visit the ETF Strategist Channel.
UPCOMING EVENTS
- Day Hagan Market Update with Donald Hagan, CFA, on February 9, 2022, at 4:15 p.m. ET
- Day Hagan Technical Analysis with Art Huprich, CMT, on February 15, 2022, at 4:15 p.m. ET
- Day Hagan/Ned Davis Research Smart Sector and NDR Catastrophic Stop Update with Art Day, on February 23, 2022, at 1:15 p.m. ET
- Day Hagan/Ned Davis Research Smart Sector and NDR Catastrophic Stop Update with Art Day, on February 23, 2022, at 4:15 p.m. ET
Disclosure: The data and analysis contained herein are provided “as is” and without warranty of any kind, either express or implied. Day Hagan Asset Management (DHAM), any of its affiliates or employees, or any third-party data provider, shall not have any liability for any loss sustained by anyone who has relied on the information contained in any Day Hagan Asset Management literature or marketing materials. All opinions expressed herein are subject to change without notice, and you should always obtain current information and perform due diligence before investing. DHAM accounts that DHAM, or its affiliated companies manage, or their respective shareholders, directors, officers and/or employees, may have long or short positions in the securities discussed herein and may purchase or sell such securities without notice. The securities mentioned in this document may not be eligible for sale in some states or countries, nor be suitable for all types of investors; their value and income they produce may fluctuate and/or be adversely affected by exchange rates, interest rates or other factors.
Investment advisory services offered through Donald L. Hagan, LLC, a SEC registered investment advisory firm. Accounts held at Raymond James and Associates, Inc. (member NYSE, SIPC) and Charles Schwab & Co., Inc. (member FINRA, SIPC). Day Hagan Asset Management is a dba of Donald L. Hagan, LLC.
