The iShares China Large-Cap ETF (NYSEArca: FXI), the biggest China-specific ETF by assets under management, is higher by almost 4.4% this month and that puts the benchmark China fund in position for a technical breakout of potentially massive significance.
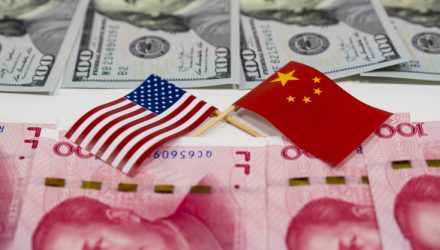
FXI and other China ETFs have recently rallied against the backdrop of cooling trade tensions between that country and the U.S., the world’s two largest economies. Still, investors need to monitor FXI’s near-term price action.
“The setup may be even more precarious for fellow ETF iShares China Large-Cap ETF (FXI), which tracks the performance of big-cap Chinese stocks traded on the Hong Kong exchange. For FXI, the chart is showing a number of notable moving averages and price points that technical traders should monitor as we head not only into a new year on Wall Street but the next phase of the trade negotiations,” according to Schaeffer’s Investment Research.
China Conundrum
Like the majority of emerging markets, China hasn’t been immune to the pangs of the market volatility within the last couple of months due to the U.S.-China trade war. While some investors may look at these equities as a possible value-oriented option, one analyst says to watch out for potential value traps.
Fortunately, the People’s Bank of China (PBOC) has been active in propping up the economy there and that could be a boon for FXI going forward.
“Those interested in round-number returns should also note that the ETF’s Friday close of $43.09 sits right near the non-trivial one-year and year-to-date +10% return level for FXI, another reason hesitation here wouldn’t be surprising,” notes Schaeffer’s. “Then there’s the 14-day Relative Index (RSI), which as of this writing continues to sit on the higher end of its range, firmly in the 60s, another indicator that suggests a cautious view on FXI is warranted in the short term.”
Related: China Technology ETFs Could Benefit the Most from Phase One Deal
When it comes to FXI’s technicals, there are other issues to consider.
“Yet even as these potentially troublesome layers loom overhead for FXI, it’s also true that they’re outnumbered by notable trendlines sitting just below,” according to Schaeffer’s. “On a short-term basis, the 80-day moving average stands out after capturing the recent downside in the ETF, while the long-term 1,000-day trendline has been supportive, as well. Circling back to our Fibonacci retracements shows the 50% retracement level coincides with a recent floor in the $41 area.”
For more information on the Chinese markets, visit our China category.
The opinions and forecasts expressed herein are solely those of Tom Lydon, and may not actually come to pass. Information on this site should not be used or construed as an offer to sell, a solicitation of an offer to buy, or a recommendation for any product.


