
By Nathan Faber, Newfound Research
The risk-free rate is often taken for granted in portfolio construction. Allocations for investors may even be determined completely ignoring this rate of return with the assumption that whatever assets are not invested in the primary portfolio of stocks, bonds, and alternatives are simply held in a bank account, money market funds, or short-term Treasuries.
When the risk-free rate is 0% or close to it, this approach makes sense.
While the risk-free rate is by no means a large factor in most investment portfolios, it is coming off its multi-year lows and showing signs that it will continue to increase over the next few years. When the choice is between getting a positive and potentially significant riskless return or zero return for uninvested cash, it helps to understand some of the impacts that falling short of the potential target can have.
What is the Risk-Free Rate?
What the actual risk-free rate is can differ in theory and practice.
The Federal Funds rate is used as the risk-free rate in many portfolio calculations. This is the rate that banks lend to each other overnight. There is no rule that says that investors have to earn this rate, but there is not much reason for them not to be able to when we consider that one goal of our fractional reserve banking system is simply for banks to get funds from investors to then lend out at a higher interest rate.
But bank accounts vary considerably in terms of their interest rates and terms (savings, checking money market, CDs, etc.).
For a savings account, getting close to the Federal Funds rate is definitely achievable, especially in the current market environment where a bank’s location has little bearing on whether you can open an account there.
But so is getting much less than the Federal Funds rate. In fact, the FDIC reports that the national average rates on savings, interest checking, and money market account rates are 0.09%, 0.06%, and 0.16%, respectively.
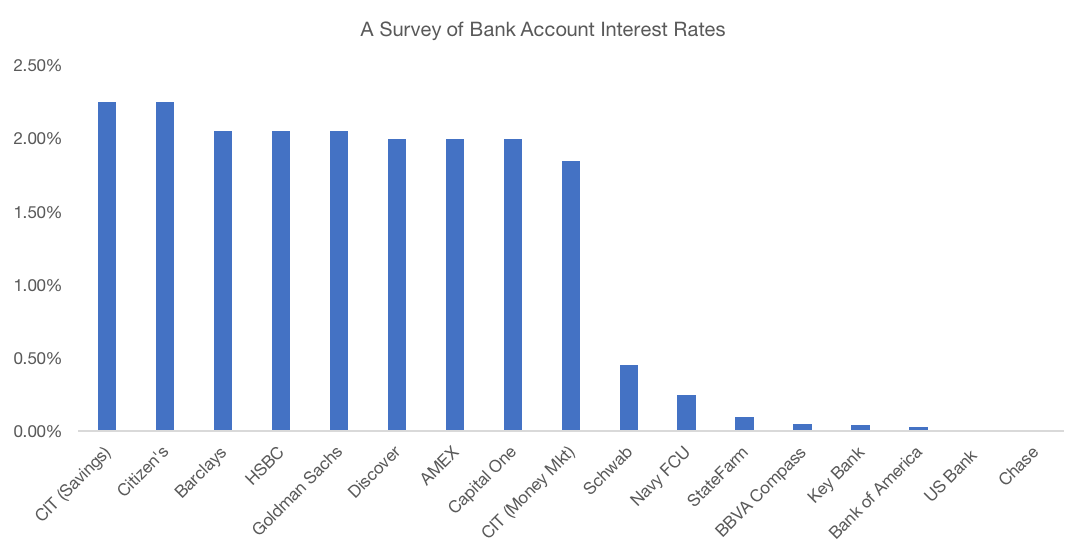
If we remove the filter on bank quality in the above screen, we can find an account for 2.5%, but this is definitely the exception to the rule based on the national statistics.1
Certificates of deposit (CDs) are another route to achieving the risk-free rate. Short-term CDs (or slightly longer term, laddered CDs) can serve as the risk-free investment vehicle as long as liquidity concerns are considered.
In an actual investment portfolio, an alternative to money market or bank account rates is available by actually investing in short-duration U.S. Treasuries, either directly or through an ETF such as the iShares Short Treasury Bond ETF (SHV). SHV’s current yield is 2.27%, which is in line with the Federal Funds risk-free rate.
The downside to this is that there may be commissions associated with moving money in and out of the asset, and advisory fees may be charged on the allocation depending on the account setup.
Practical issues of accessing these options aside, the bottom line is that there exists a large variance in precise rate available to a given investor at any given time. In this rest of this commentary we aim to demonstrate that this creates a non-trivial impact both on portfolio construction and returns.
Growth of the Risk-Free Asset
Since 1926, the risk-free rate has fluctuated considerably.
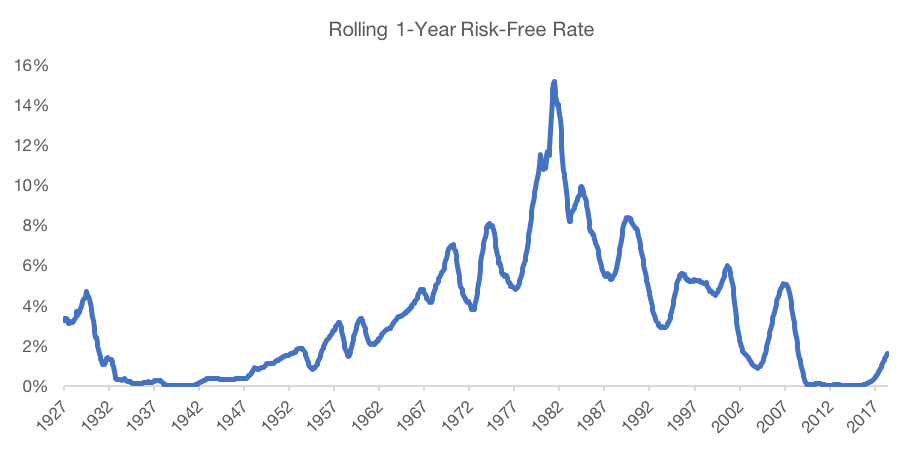
Source: Kenneth French Data Library. Data as of October 2018.
Its median value on a rolling 12-month basis has been 2.9%, but it has ranged from 0% to 15.2%. The multi-year lows of the 2010s had not been seen since the Great Depression era.
When we look at how this translates into compounded growth, there is a sizeable amount of money left on the table when the actual risk-free rate is not achieved.
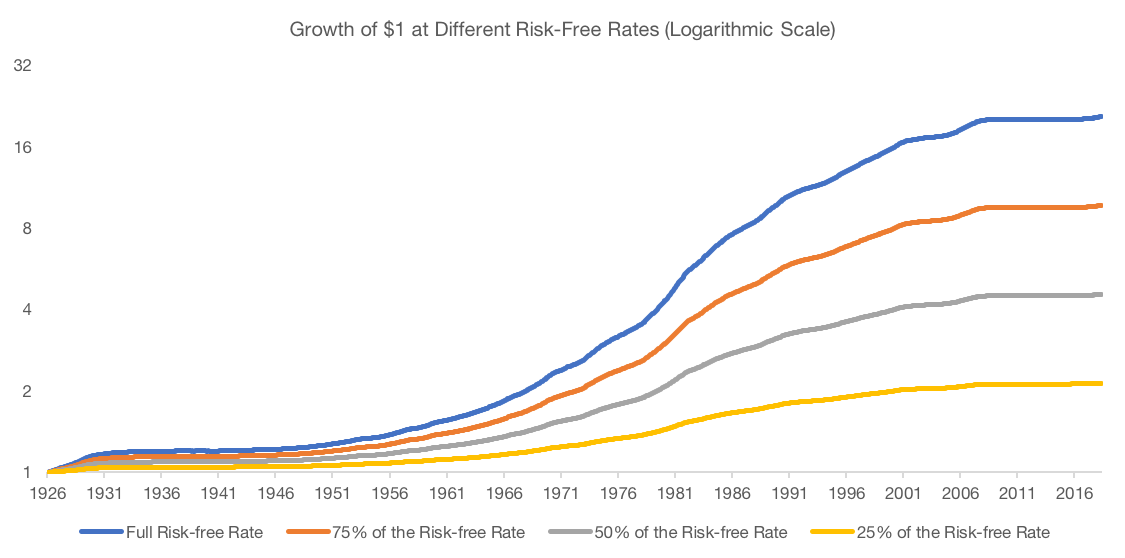
Source: Kenneth French Data Library. Calculations by Newfound. Data as of October 2018.
In the broader context of a portfolio, these results scale based on the actual cash allocation.
If cash earning the risk-free rate were used as the bond component of a 75/25 portfolio, which is not unrealistic for someone who has a larger liquidity reserve and a smaller asset base, this equates to 20 bps per year.
If rebalancing is considered, then the differential is slightly larger (around 25 bps) because as the risk-free rate is increased, when equities are up, less capital is moved away from stocks at the rebalance, and when equities are down, more capital is available for investing through the drawdowns and realizing the (desired) subsequent recovery.
This benefit may not seem like much, but considering how aggressively investors will pursue reducing fees by the same amount, any incremental return helps.
The analogy with fees breaks down unless the fee reduction is obtained for identical strategies (e.g. two S&P 500 funds). This difference in the return from the risk-free rate is not like switching from one value strategy to another because one has a 20 bps lower expense ratio: money saved can easily be eclipsed by the differences in the strategy dynamics.
