
By Doug Sandler, Chris Konstantinos & Rod Smyth, RiverFront Investment Group
With the S&P 500 down over 5% month-to-date, investors are once again worried about the end of the bull market. The strife experienced over the past few weeks is not unusual for this time of year. According to LPL Research, October has historically been the month with the highest probability of experiencing 1% changes or more in the S&P 500. For this reason, we believe it is important to remain focused on the fundamentals. This Weekly View is dedicated to the charts that we will be paying the most attention to over the coming weeks and months.
We continue to believe:
- Global growth will continue in 2019
- Japan will grow slowly with continued profit margin expansion
- US raising rates reduces monetary backstop
- European and Japanese Central Banks to remain supportive for foreseeable future
- Markets like certainty and should ‘calm down’ after mid-terms are decided, no matter the results
Market Climbs Wall of Worry
As concerns regarding trade and mid-term elections take center-stage, it is important to recognize that global equities have weathered far worse storms over history, in our view.
![]()

Source: RiverFront. Past performance is no guarantee of future results. Shown for illustrative purposes only. Arrows pointing towards approximate time frames.
No Recession In Sight Yet
Earnings momentum (blue line – the net number of positive analyst earnings-per-share estimate revisions, divided by the total number of estimates) for the S&P 500 index recently reached levels of positive momentum that we haven’t seen in over a decade.
We think this momentum is related to positive economic fundamentals – as demonstrated by the ISM manufacturing survey (dotted green line) – as well as corporate tax reform.
In looking at the behavior of the ISM survey and earnings revisions around past recessionary periods in the US (shaded regions), it is difficult for us to foresee an imminent recession.

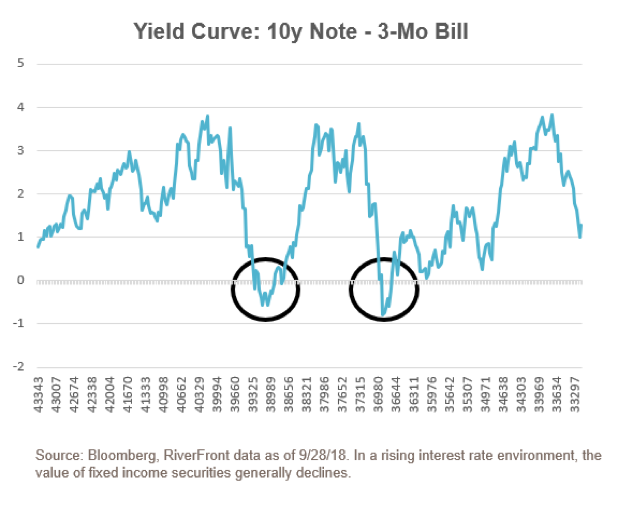
YIELD CURVES FLATTENING, BUT NOT YET FLAT OR INVERTED
10-Year to 3-Month Spread: The yield curve is the relationship between shorter and longer-term interest rates. Historically, recessions occur when the yield curve inverts (see circles to left). We are less concerned because:
- Flattening yield curves are normal as economic expansions mature.
- The Fed has consistently reiterated its goal of normalizing interest rates and supporting growth, not slowing the economy.
- Due to quantitative easing (QE) this monetary cycle is likely to be different, in our view, making traditional yield-curve signals potentially less predictive.
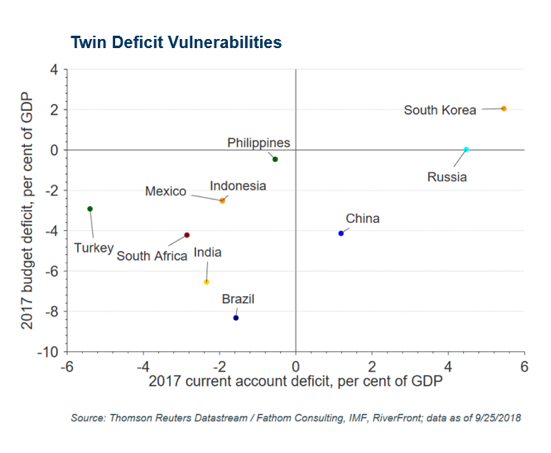
Emerging markets Under Pressure, But contagion unlikely, in our view
Emerging market (EM) equities and currencies have had a dreadful 2018.
Bad News: Most of the ‘B.R.A.T.S.’ (Brazil, Russia, Argentina, Turkey and South Africa) find themselves in a precarious ‘twin deficit’ position.
Good News: The largest EM economies, such as China and Korea, are not as vulnerable, and thus likely to protect EM from the contagion that impacted markets in ’94 and ‘98.
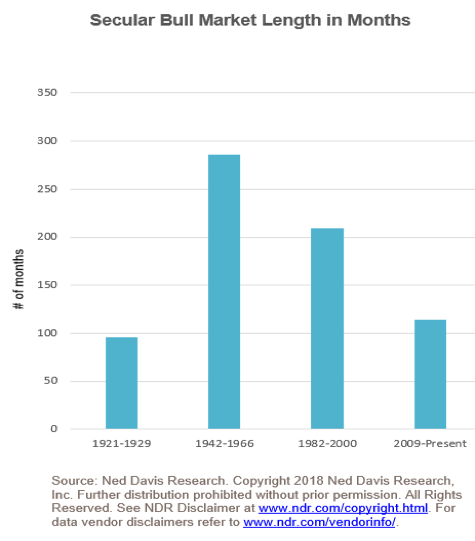
Secular Bull Markets can last decades
Secular bull and bear markets are different than cyclical bull and bear markets, in that the first can span decades and have significant long-term financial impacts.
In our view, long-term investors should focus on participating in secular bull markets and avoiding secular bear markets; rather than worrying too much about cyclical bull and bear cycles.
Ned Davis Research (NDR) identifies 4 secular bull markets since the 1920’s including the current one. If NDR is correct in their view, there is precedent for the current secular bull market to continue.
Us vs International: Leadership Due for a Shift
- While the yearly ‘win percentage’ of international versus the US since the early 1970’s is identical, there were two long mega-streaks for each side, including the decade-long streak the US is currently riding.
- Streaks all come to an end, and the US’s current streak is about as long as any in the last five decades.
As international fundamentals slowly turn positive, a catalyst may exist for the US’s period of outperformance to end.
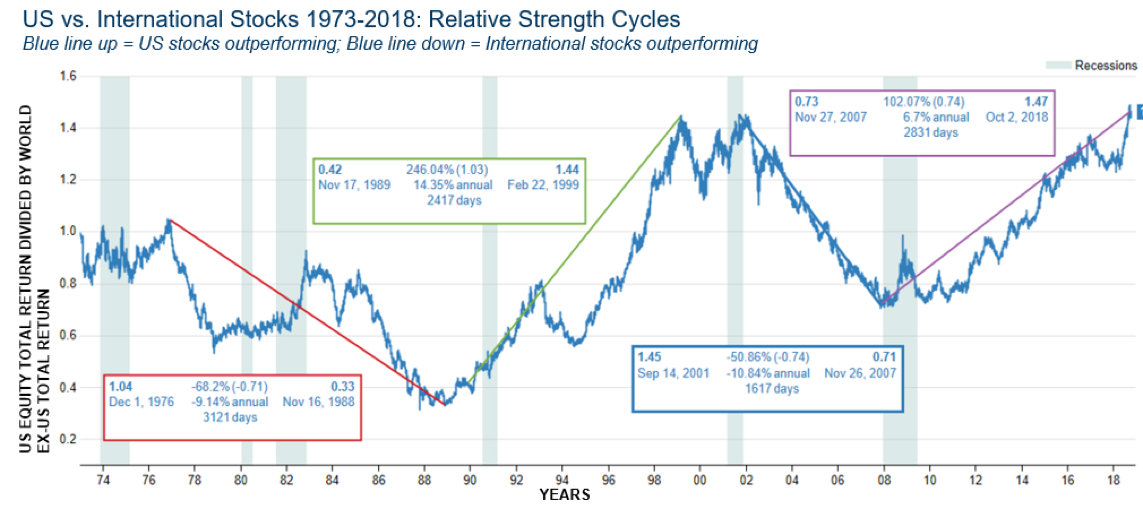
Source: Thomson Reuters Datastream, RiverFront; data to 10/2/2018. Past performance is no guarantee of future results.
Positioned for Sustained Bull Market in Stocks, Burgeoning Bear Market in Bonds
- We believe global equities are in a ‘decision
box’. - We believe that the bottom of the box will hold
and that in coming months prices will penetrate
the top of the box. - We are positioned for stocks to perform better
than bonds. - We prefer non-US stocks to US stocks over a
longer timeframe. - We prefer Japan to Europe.
- We expect interest rates to rise slightly.
- We have risk management plans in place if we are wrong.

Source: Factset, RiverFront. You cannot invest directly in an index. Past performance is no guarantee of future results. Not indicative of RiverFront performance.
Doug Sandler, CFA, is Global Strategist; Chris Konstantinos, CFA, is Chief Investment Strategist; and Rod Smyth is Director of Investments at RiverFront Investment Group, a participant in the ETF Strategist Channel.
Important Disclosure Information
